Closelook@Global Stock Markets
The Bill Came Before the Number
Last Saturday the record arrived with a bill attached. This week the market paid it early — the world index gave back its record in four sessions and closed five cents under the line this letter set, the belly of the curve failed a fifth time at a new low, both hedges lost their levels — and then bought the hot inflation number on Friday. The question into the Fed is whether it pays twice.
Current edition · 2026-09-12
1 · This Week's Action
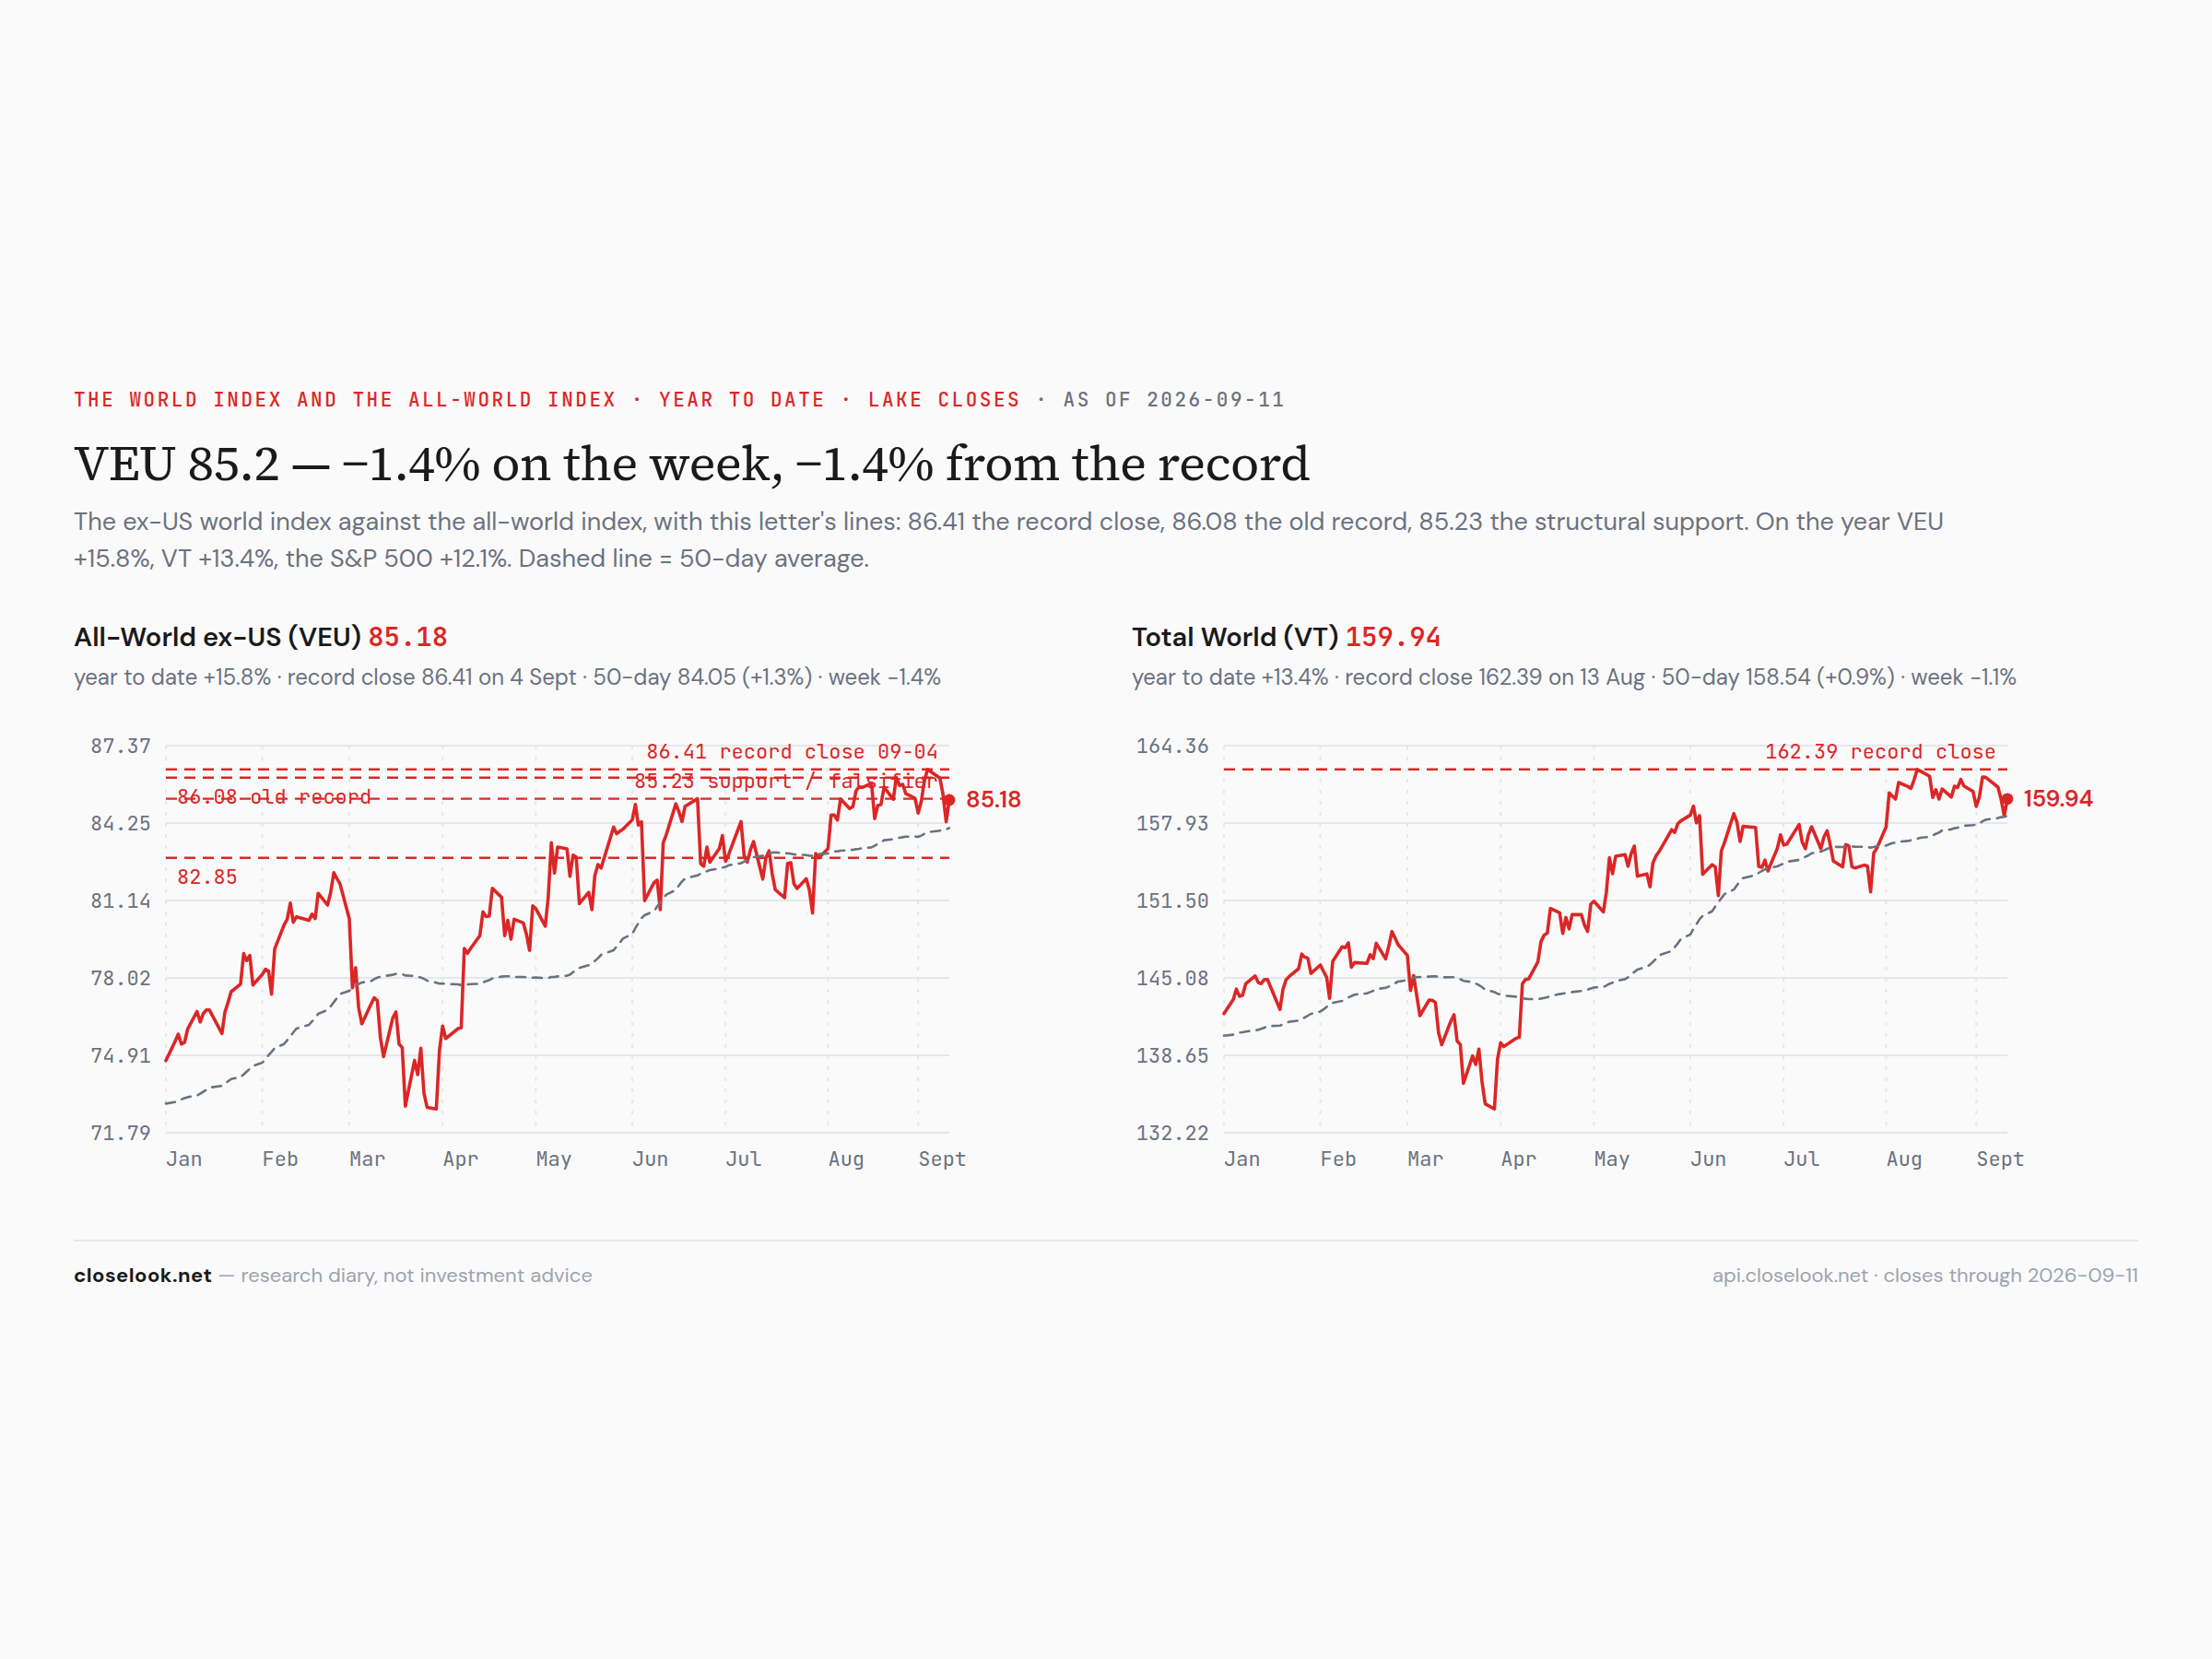
The global view. The ex-US world index closed the week at 85.18, down 1.42% — five cents under the 85.23 support this letter set last Saturday as the weekly-close falsifier. The record close of 86.41 lasted one session: Tuesday 86.06 (Monday was Labor Day in New York), Wednesday 85.39, Thursday 84.30 — the low of the move, under the support by almost a dollar — and Friday 85.18, a recovery that stopped a nickel short of the line. Last week's edition said a weekly close under 85.23 "ends a record, not a drift." On the letter's own standard, that is what this week's close did. The all-world index closed 159.94, down 1.11%, 1.5% under its August 13 record; the S&P fell 0.77%, the Nasdaq 100 0.57%.
The year's order held but narrowed. VEU +15.8% for 2026, VT +13.4%, the S&P +12.1% — the ex-US lead over America is 3.7 points, from 4.5 last week, because this was a week the world gave back more than America did. It is the first stay-home week in two, and it came with the record's reversal.
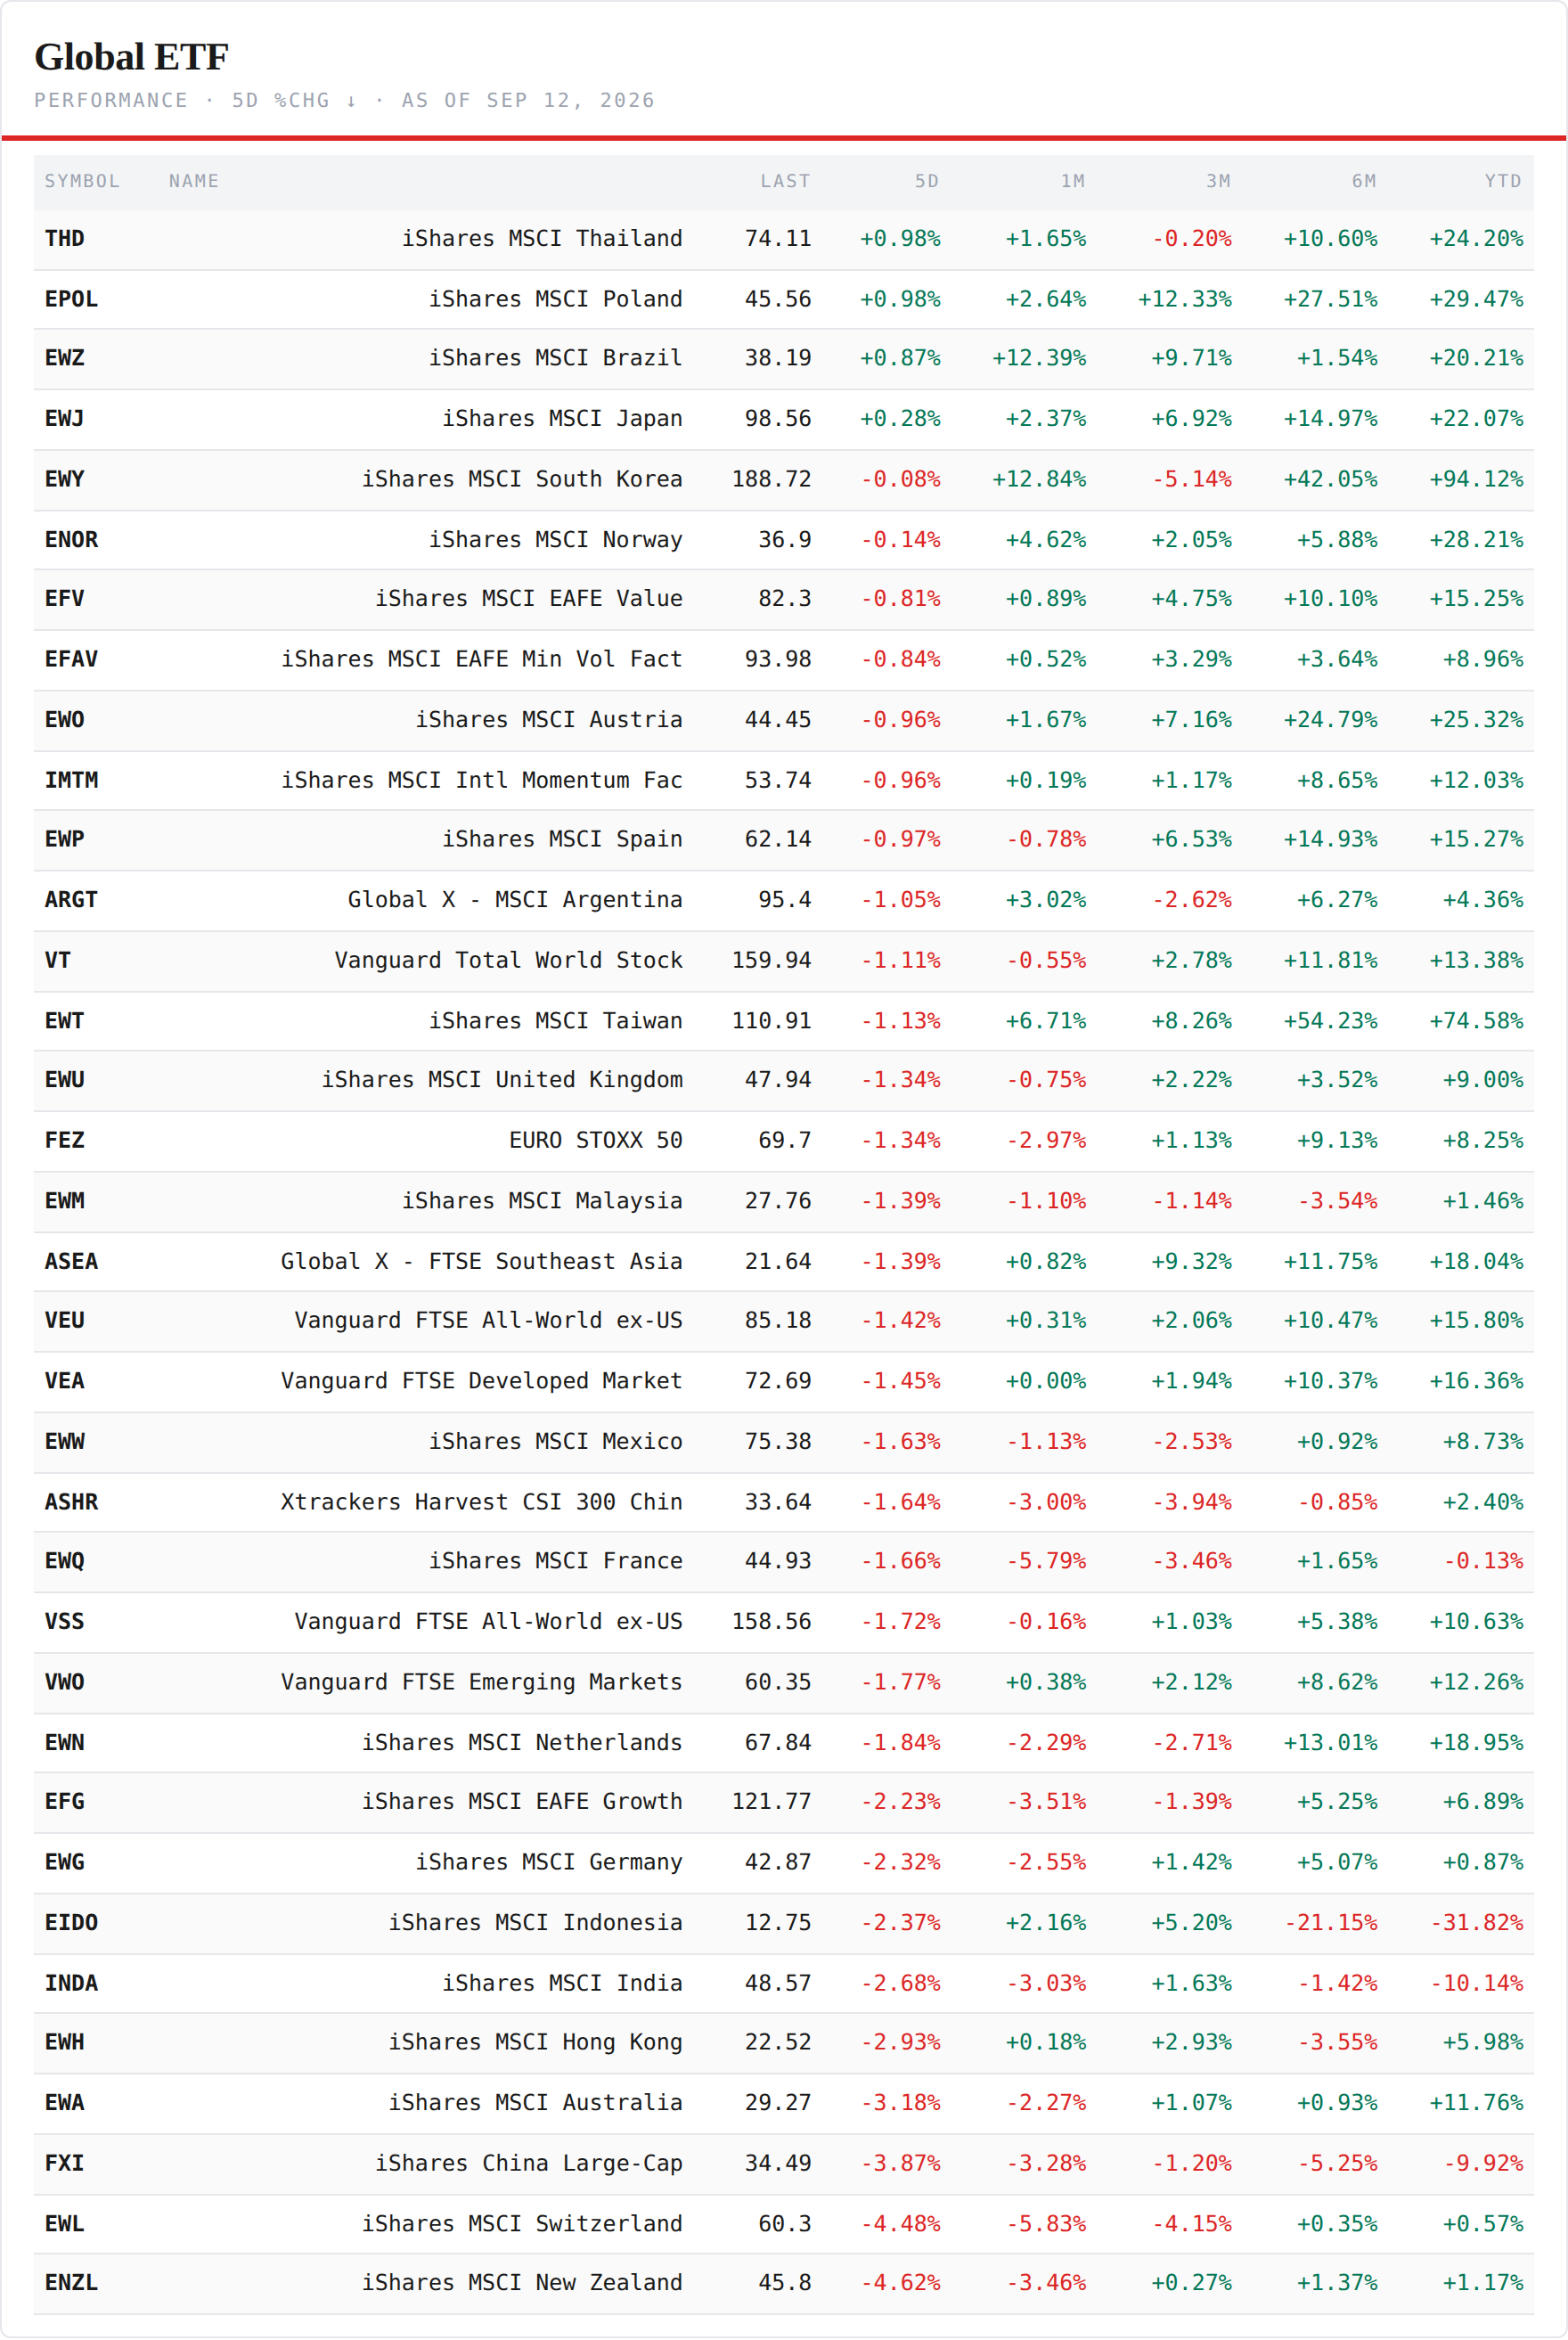
Korea is where the certificate was tested — twice, and it held on the week. Last Saturday this letter set the frame: hold above 183.46 on the weekly closes, 190.11 the sidecar-day cap. The fund did both things the frame did not ask for: Wednesday it closed 190.78, through the cap on a daily close; Thursday it closed 182.78, under the high water on a daily close, a 4.2% session. Friday's 188.72 put it back between the lines — −0.08% on the week, flat to the cent, above 183.46 on the weekly close and under 190.11. In Seoul the week was not flat: the Kospi rose 3.3% in won, from 6,687 to 6,910, touched 7,172 on Tuesday, closed above 7,000 on Monday, Wednesday and Thursday, and finished the week below it. The dollar wrapper had paid for Monday's 4.2% Seoul session on Friday September 4, in New York, before Seoul opened — which is why the local index is up three percent on the week and the fund is unchanged. +94.1% on the year in dollars.
Behind it the regional board inverted for a fifth time in six weeks. Last week's twenty-eight green of thirty-five became four green of thirty-one red — the narrowest board since this letter began tracking the breadth flips in July. The four: Thailand +0.98%, Poland +0.98%, Brazil +0.87%, Japan +0.28% — two periphery lines, one commodity exporter, and the one developed market whose currency was the story. The bottom was three continents wide: New Zealand −4.62%, Switzerland −4.48% the worst large market, China large-caps −3.87%, Australia −3.18%, Hong Kong −2.93%, India −2.68%, Indonesia −2.37%, Germany −2.32%. The best-to-worst spread narrowed to 5.60 points from 8.07 — a board that goes red almost everywhere while its spread narrows is de-grossing, not dispersing. Last week the money changed neighborhoods; this week it left.
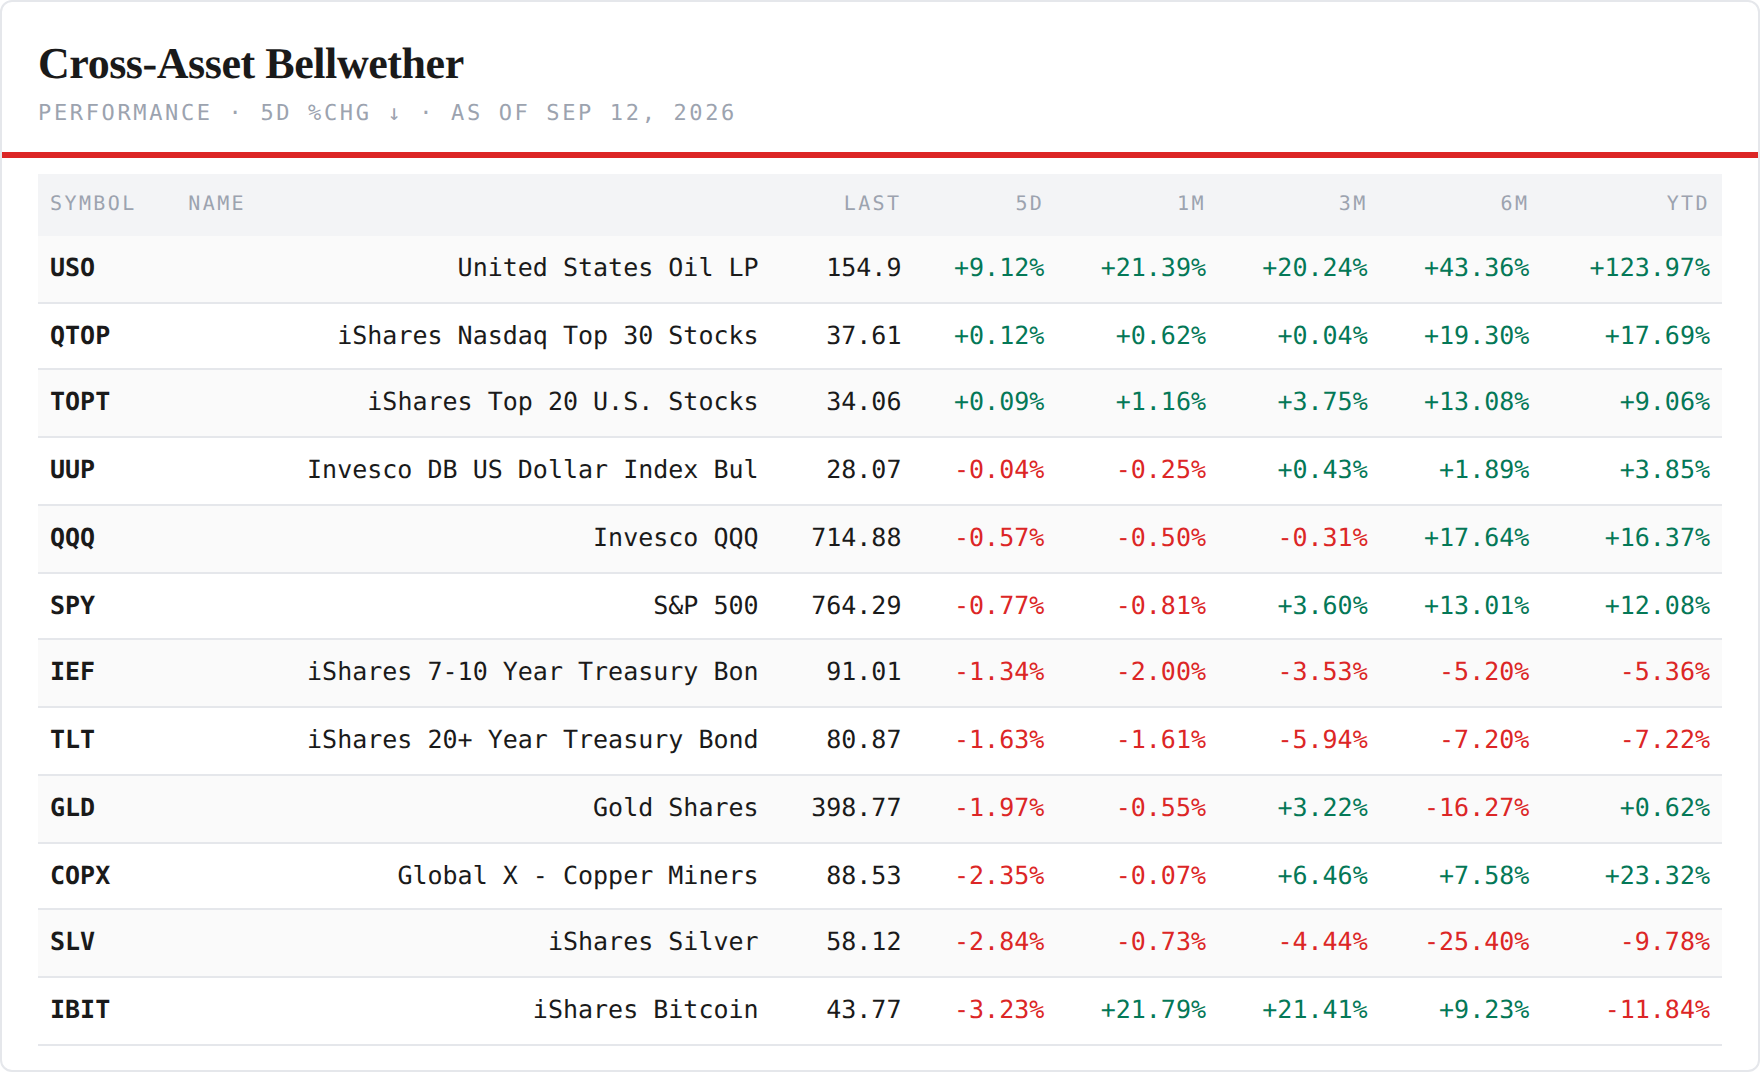
The cross-asset backdrop — the barrel again, and then everything else again. USO +9.12% led the board by a distance for a second consecutive week — two nine-percent weeks back to back, +124% on the year — and the reason sits in section 2: Brent closed above $100 on Wednesday for the first time since July and settled $107.63 on Thursday after Houthi attacks cut Saudi capacity by about 600,000 barrels a day. The only other green lines were the two megacap wrappers, +0.12% and +0.09%, and the dollar was flat. The bottom: the bitcoin fund −3.23%, silver −2.84%, copper miners −2.35%, gold −1.97%, the long bond −1.63%, the belly −1.34%, the S&P −0.77%, the Nasdaq 100 −0.57%. Three green, nine red. Last week the oil line and the copper line pointed in opposite directions and this letter called it a supply shock, not a growth signal; this week they still do, and the two duration lines fell with both hedges, which is the supply shock arriving in the discount rate. The funding tells did not harden this week. They broke.
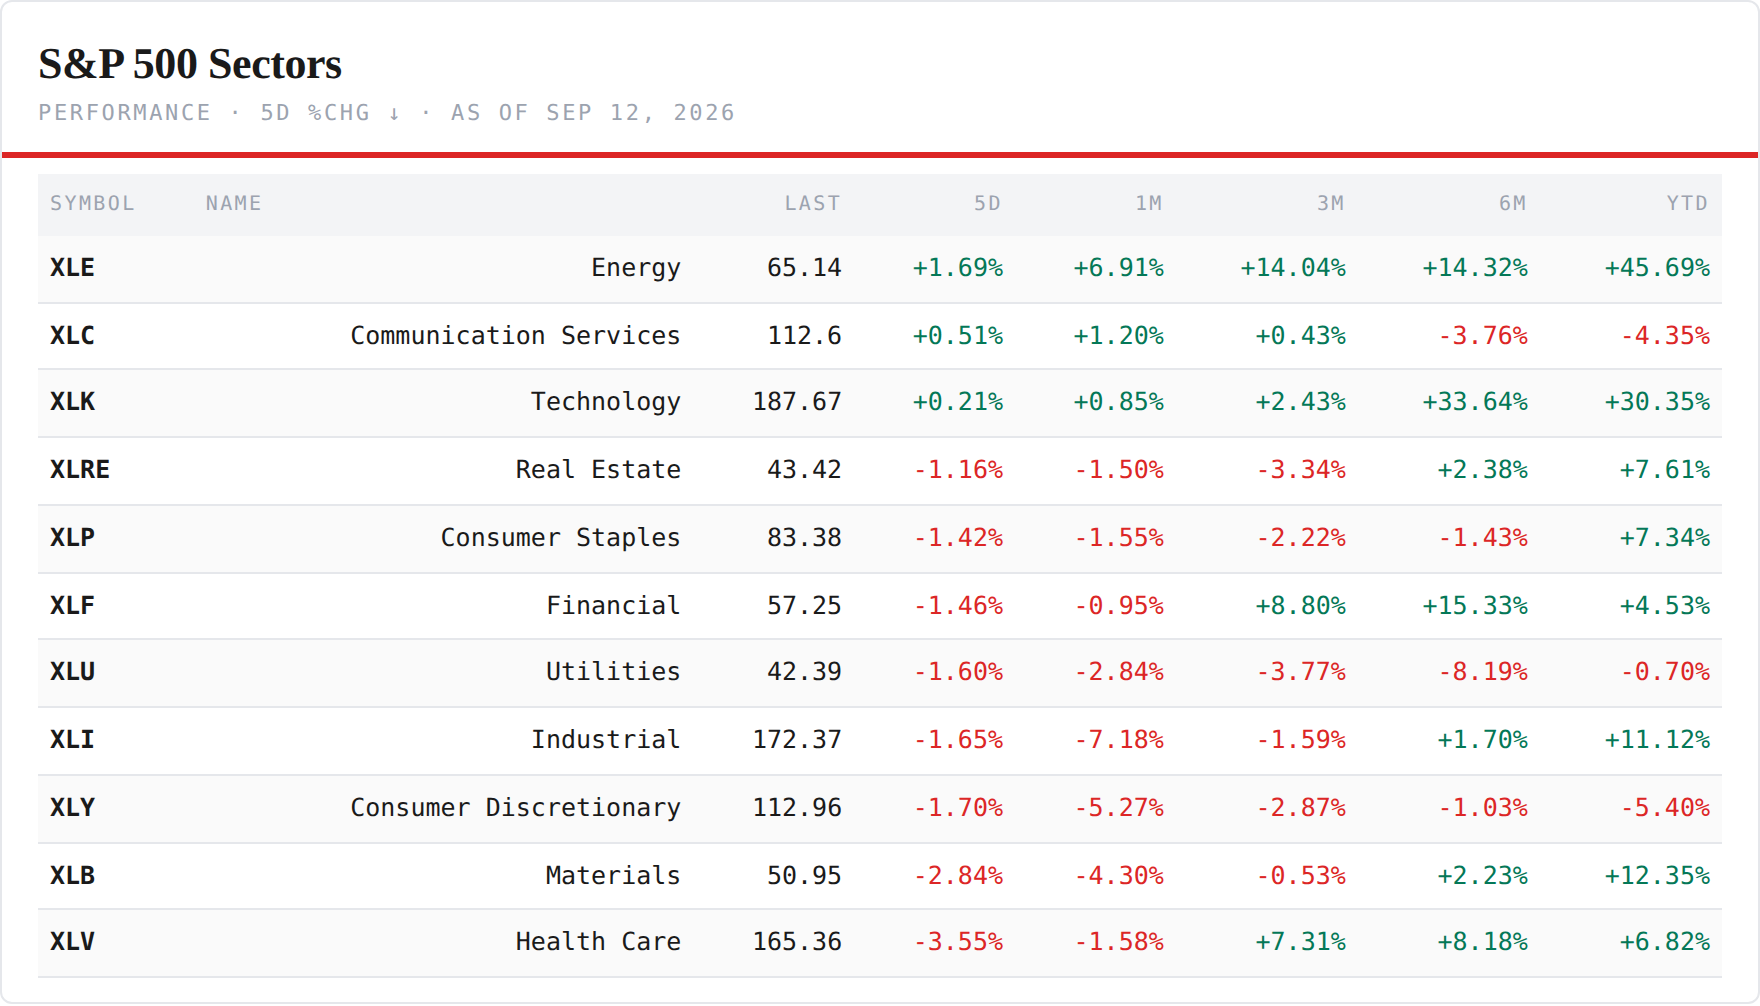
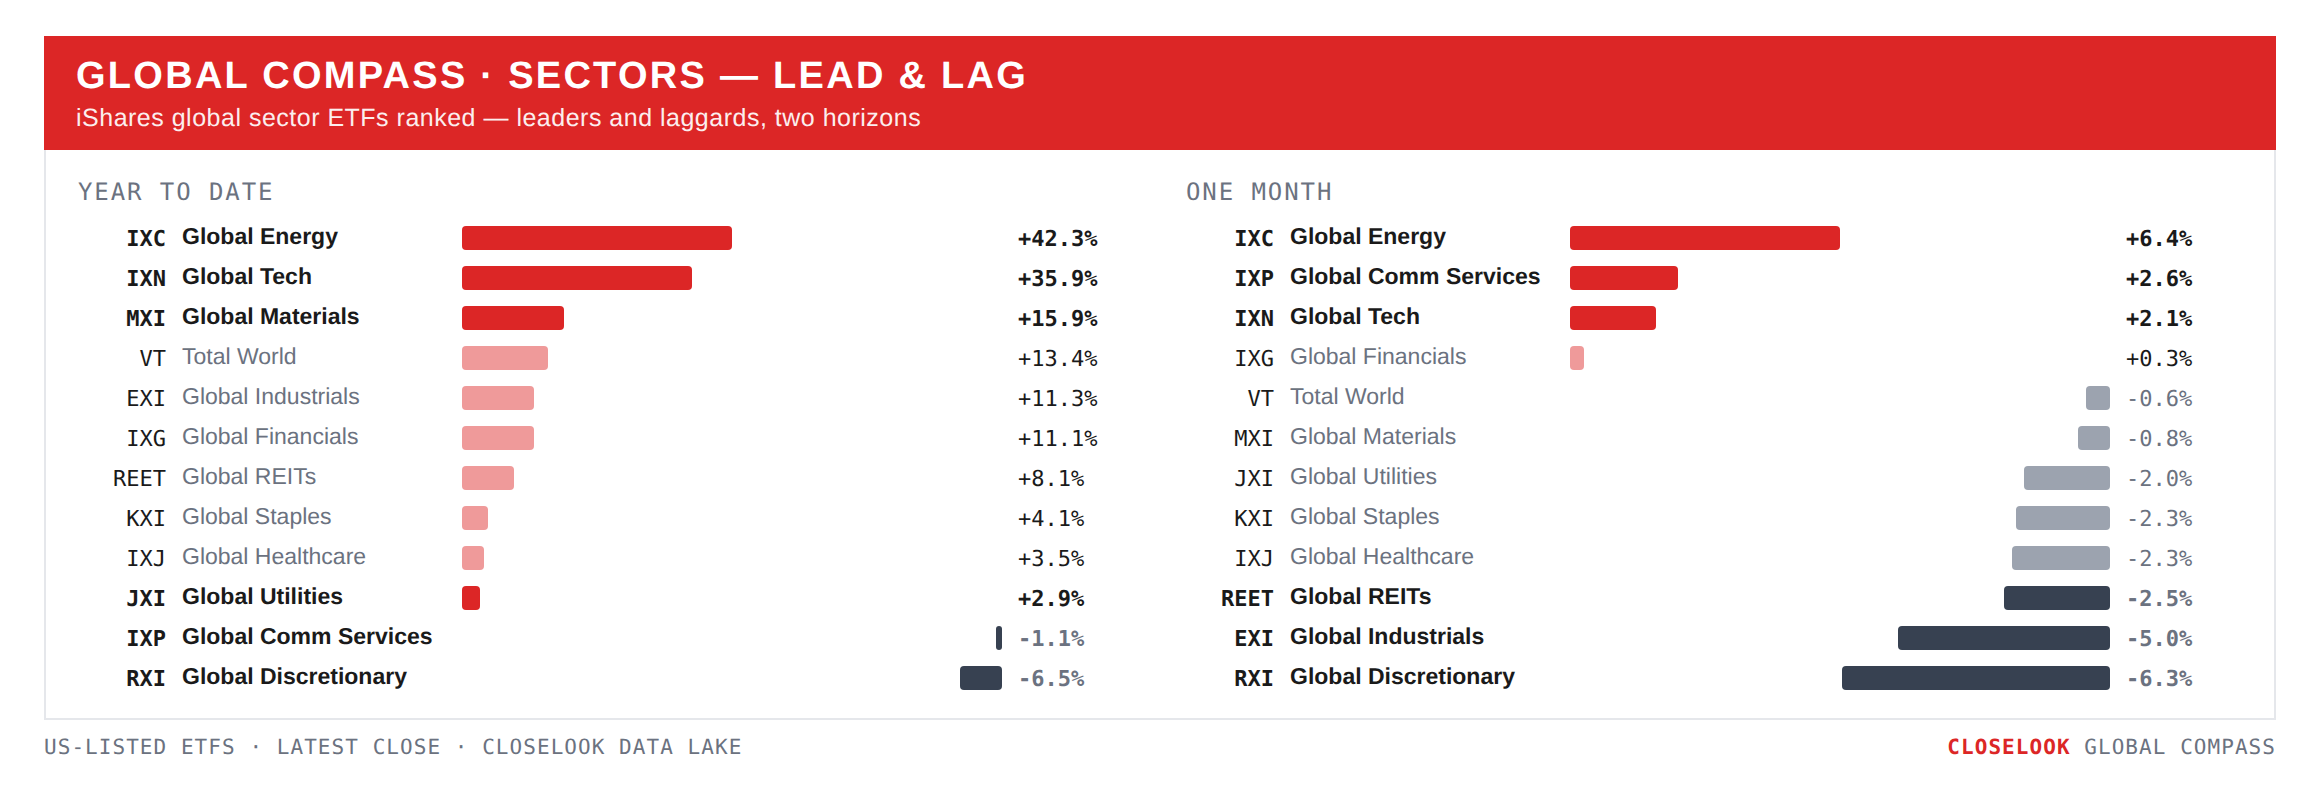
The US sectors. Three of eleven closed green: energy +1.69%, communications +0.51%, technology +0.21%. The bottom: health care −3.55% — the worst US sector by a distance, and section 1's engine says it was the worst sector on earth — materials −2.84%, discretionary −1.70%, industrials −1.65%, utilities −1.60%, financials −1.46%, staples −1.42%, real estate −1.16%. Not the duration sort of last week, when the rate-sensitive groups and the commodity groups sat at the bottom together. This is a sort with two floors: the commodity-input groups (materials, industrials) still down, but the defensives — health care, utilities, staples — down as much or more. Sunday's letter owns the tape beneath it; the geography is that a market selling its defensives on a down week is a market raising cash, not rotating.
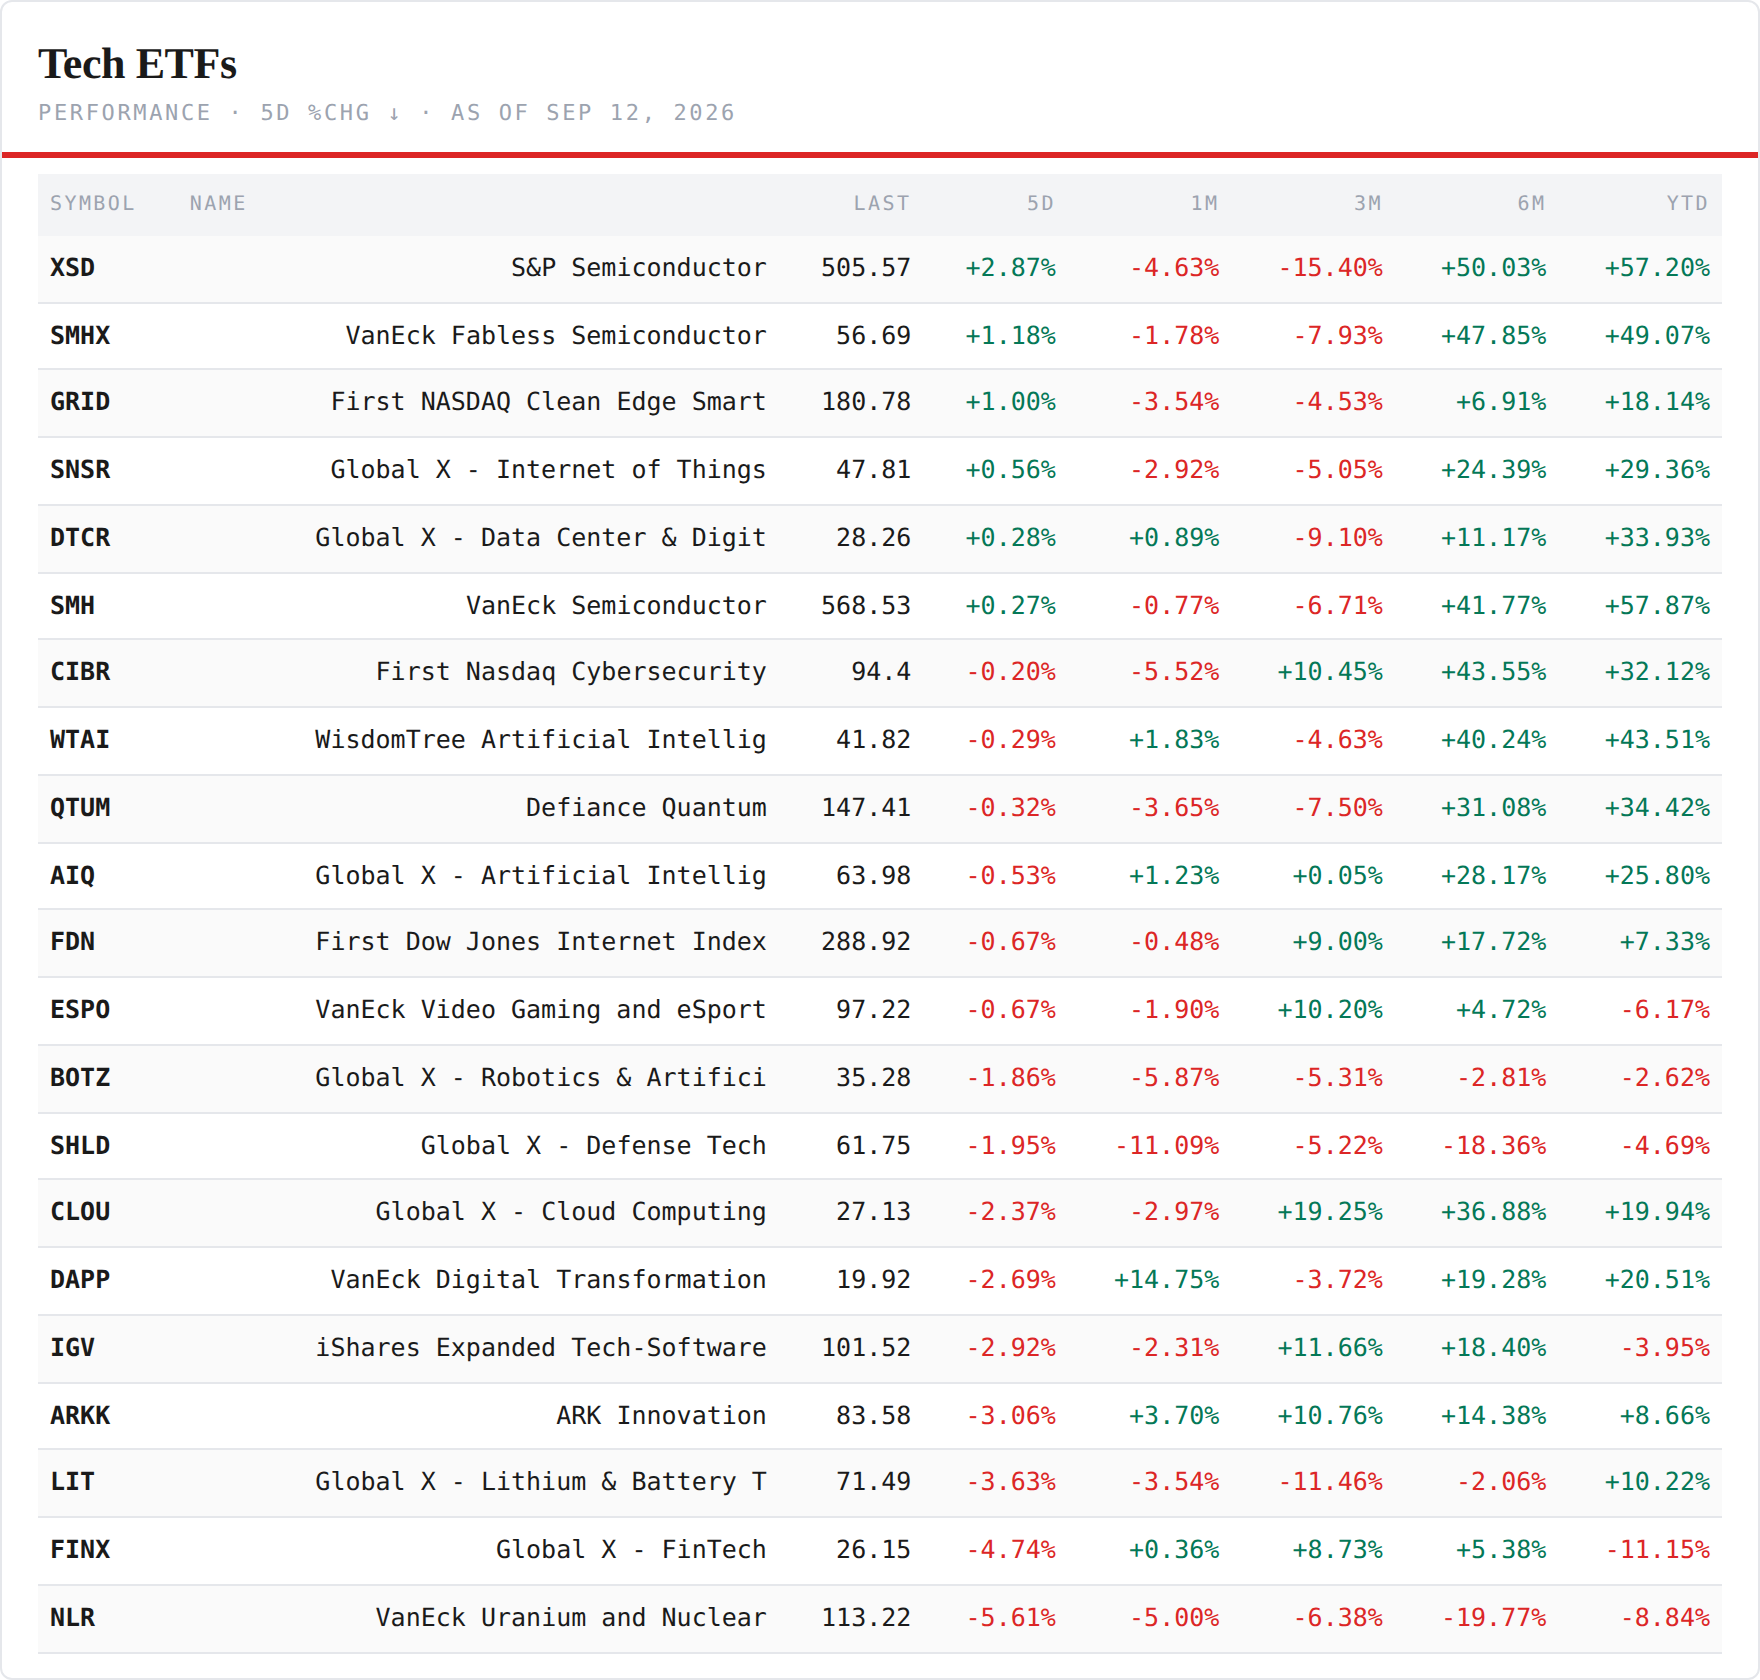
The tech ETFs — the split held, and the chip stack split inside itself. Six green lines of twenty-one, and five of the six are silicon or the pipe to it: the S&P semiconductor fund +2.87% led the board, the fabless vehicle +1.18%, the grid fund +1.00%, the IoT line +0.56%, data centers +0.28%, SMH +0.27%. The red fifteen are the layer above the chip and the two side-bets: uranium −5.61%, fintech −4.74%, lithium −3.63%, ARK −3.06%, software −2.92% — a third consecutive week as one of the board's worst lines — digital assets −2.69%, cloud −2.37%. The software-to-semis ratio kept falling; the pair monitor reads the spread at 0.6 standard deviations, closing from 1.1. Two weeks of software over silicon, now two weeks of silicon over software, and the sort has a name from last week: duration. What changed inside the stack is the part Sunday's Hypergrowth letter owns — the equal-weight semis (+2.87%) beat the cap-weighted (+0.27%) by two and a half points because Nvidia fell 4.45% and the memory names were sold on Thursday and not bought back on Friday. The chip trade is no longer one trade.
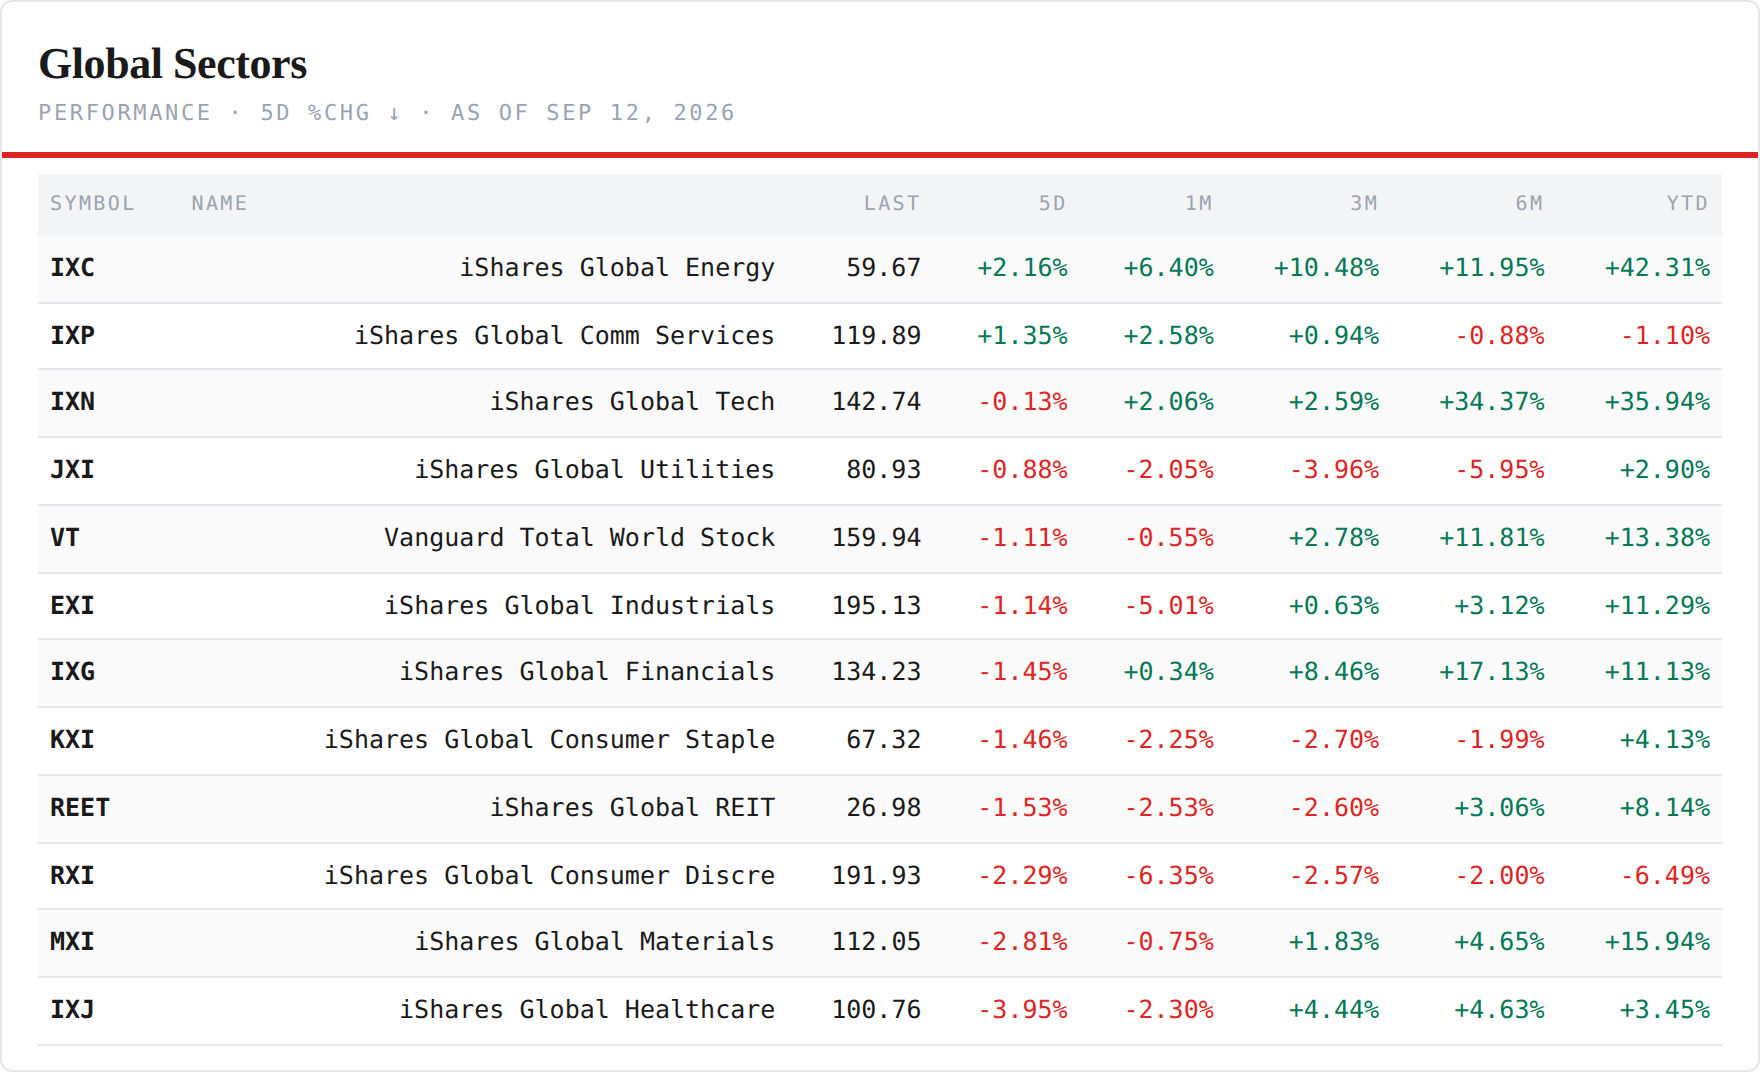
The global sectors. Two green of twelve: energy +2.16% and communications +1.35%. Technology −0.13%, flat. Then the decider this letter has tracked for four editions: global financials fell 2.02% to 134.23 — from the 137.00 record set on September 3 to under the 134.55 August line, in six sessions. Materials −2.81% to 112.05, under the February line for a third week; the bottom is health care −3.95%, the worst global sector, with consumer discretionary −2.29% and REITs −1.53% beside it. Three editions ago materials set a record and un-cleared its line within five sessions. This week financials did the identical thing on a one-week delay. Two of the four sectors that decide the tape have now taken a record and given it back inside a week; the pattern this letter has been describing since August has a second data point, and it is the same shape.
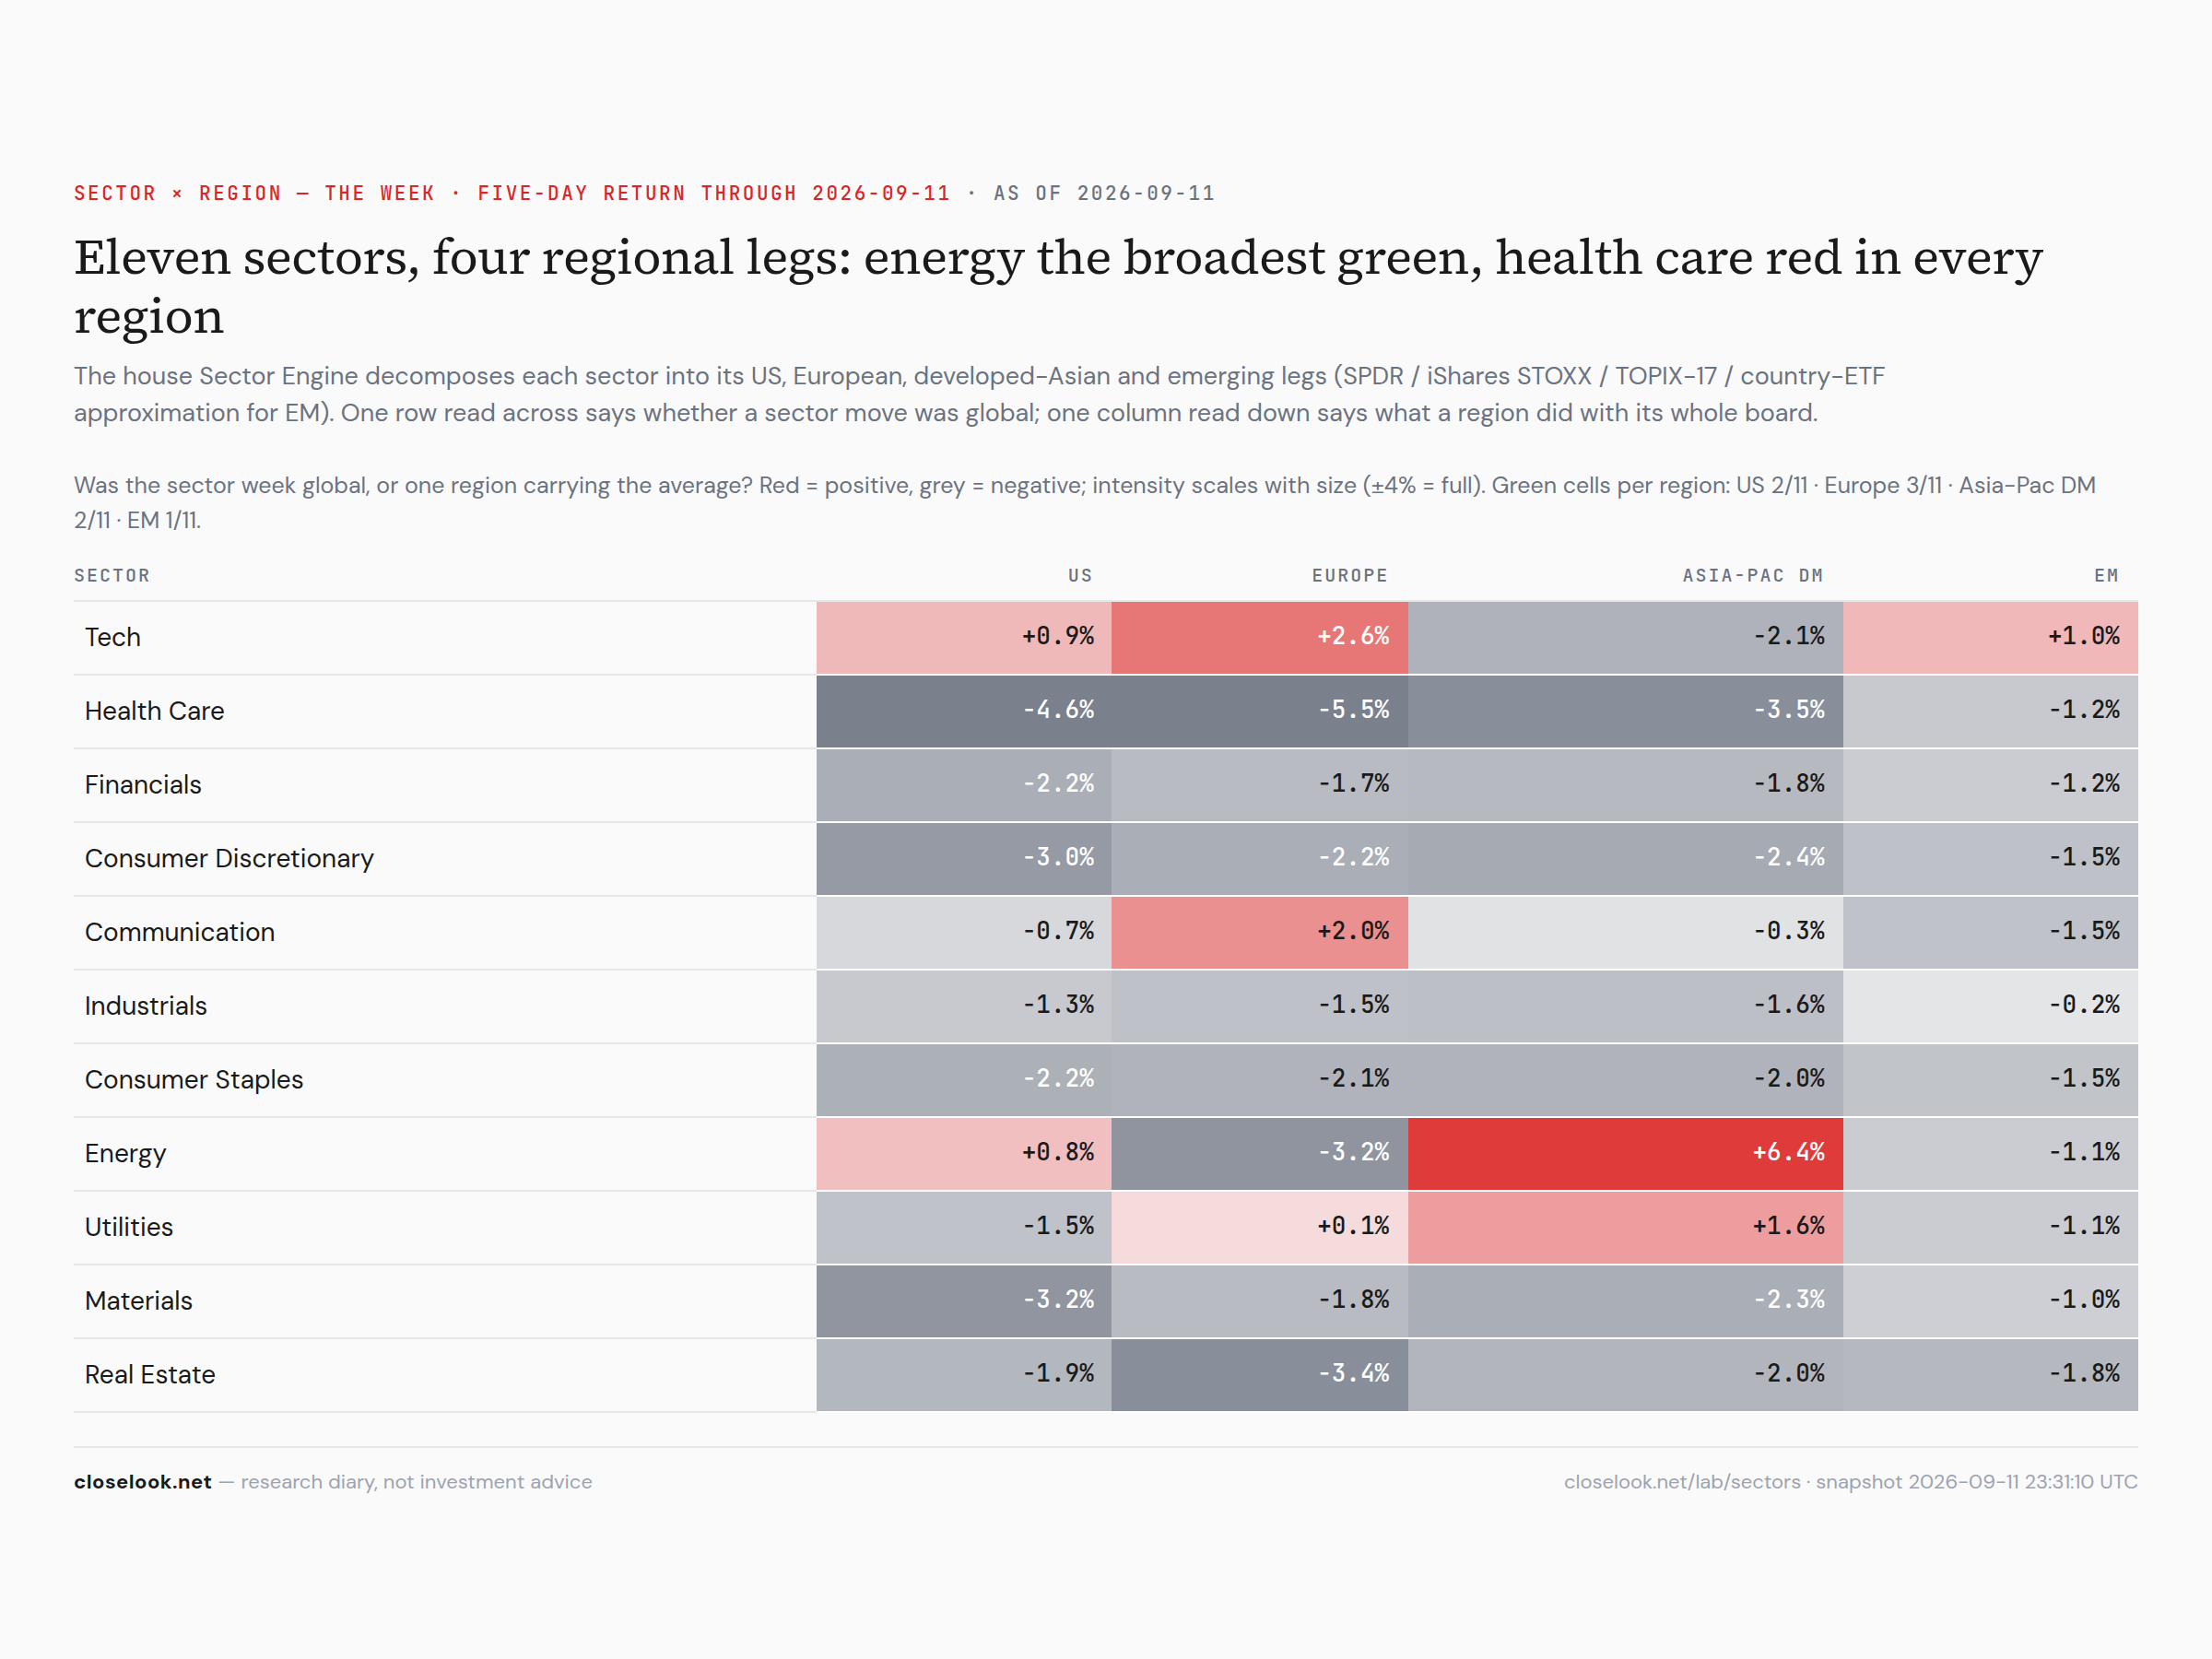
Was the sector week global, or one region carrying the average? The house Sector Engine decomposes each of the eleven sectors into its four regional legs, and this week's answer is the mirror of last week's: eight cells green of forty-four. Last week every emerging-market cell was green; this week EM has one green cell in eleven — technology, +1.0%. The US has two (tech +0.9%, energy +0.8%), Europe three (tech +2.6%, communications +2.0%, utilities +0.1%), developed Asia two (energy +6.4%, utilities +1.6%). Health care was red in all four regions — US −4.6%, Europe −5.5%, developed Asia −3.5%, EM −1.2% — the only sector red everywhere, and the worst cell on the board in Europe. And the sharpest single split, for a third consecutive week, is energy, with the sign alternating a third time: the US cut +0.8%, Europe's energy −3.2%, and developed Asia's +6.4% — the strongest cell on the entire board, the Tokyo-proxied refiners and trading houses catching the barrel Europe's integrated majors did not. Three weeks, three different regions owning the same commodity.
The Global Compass
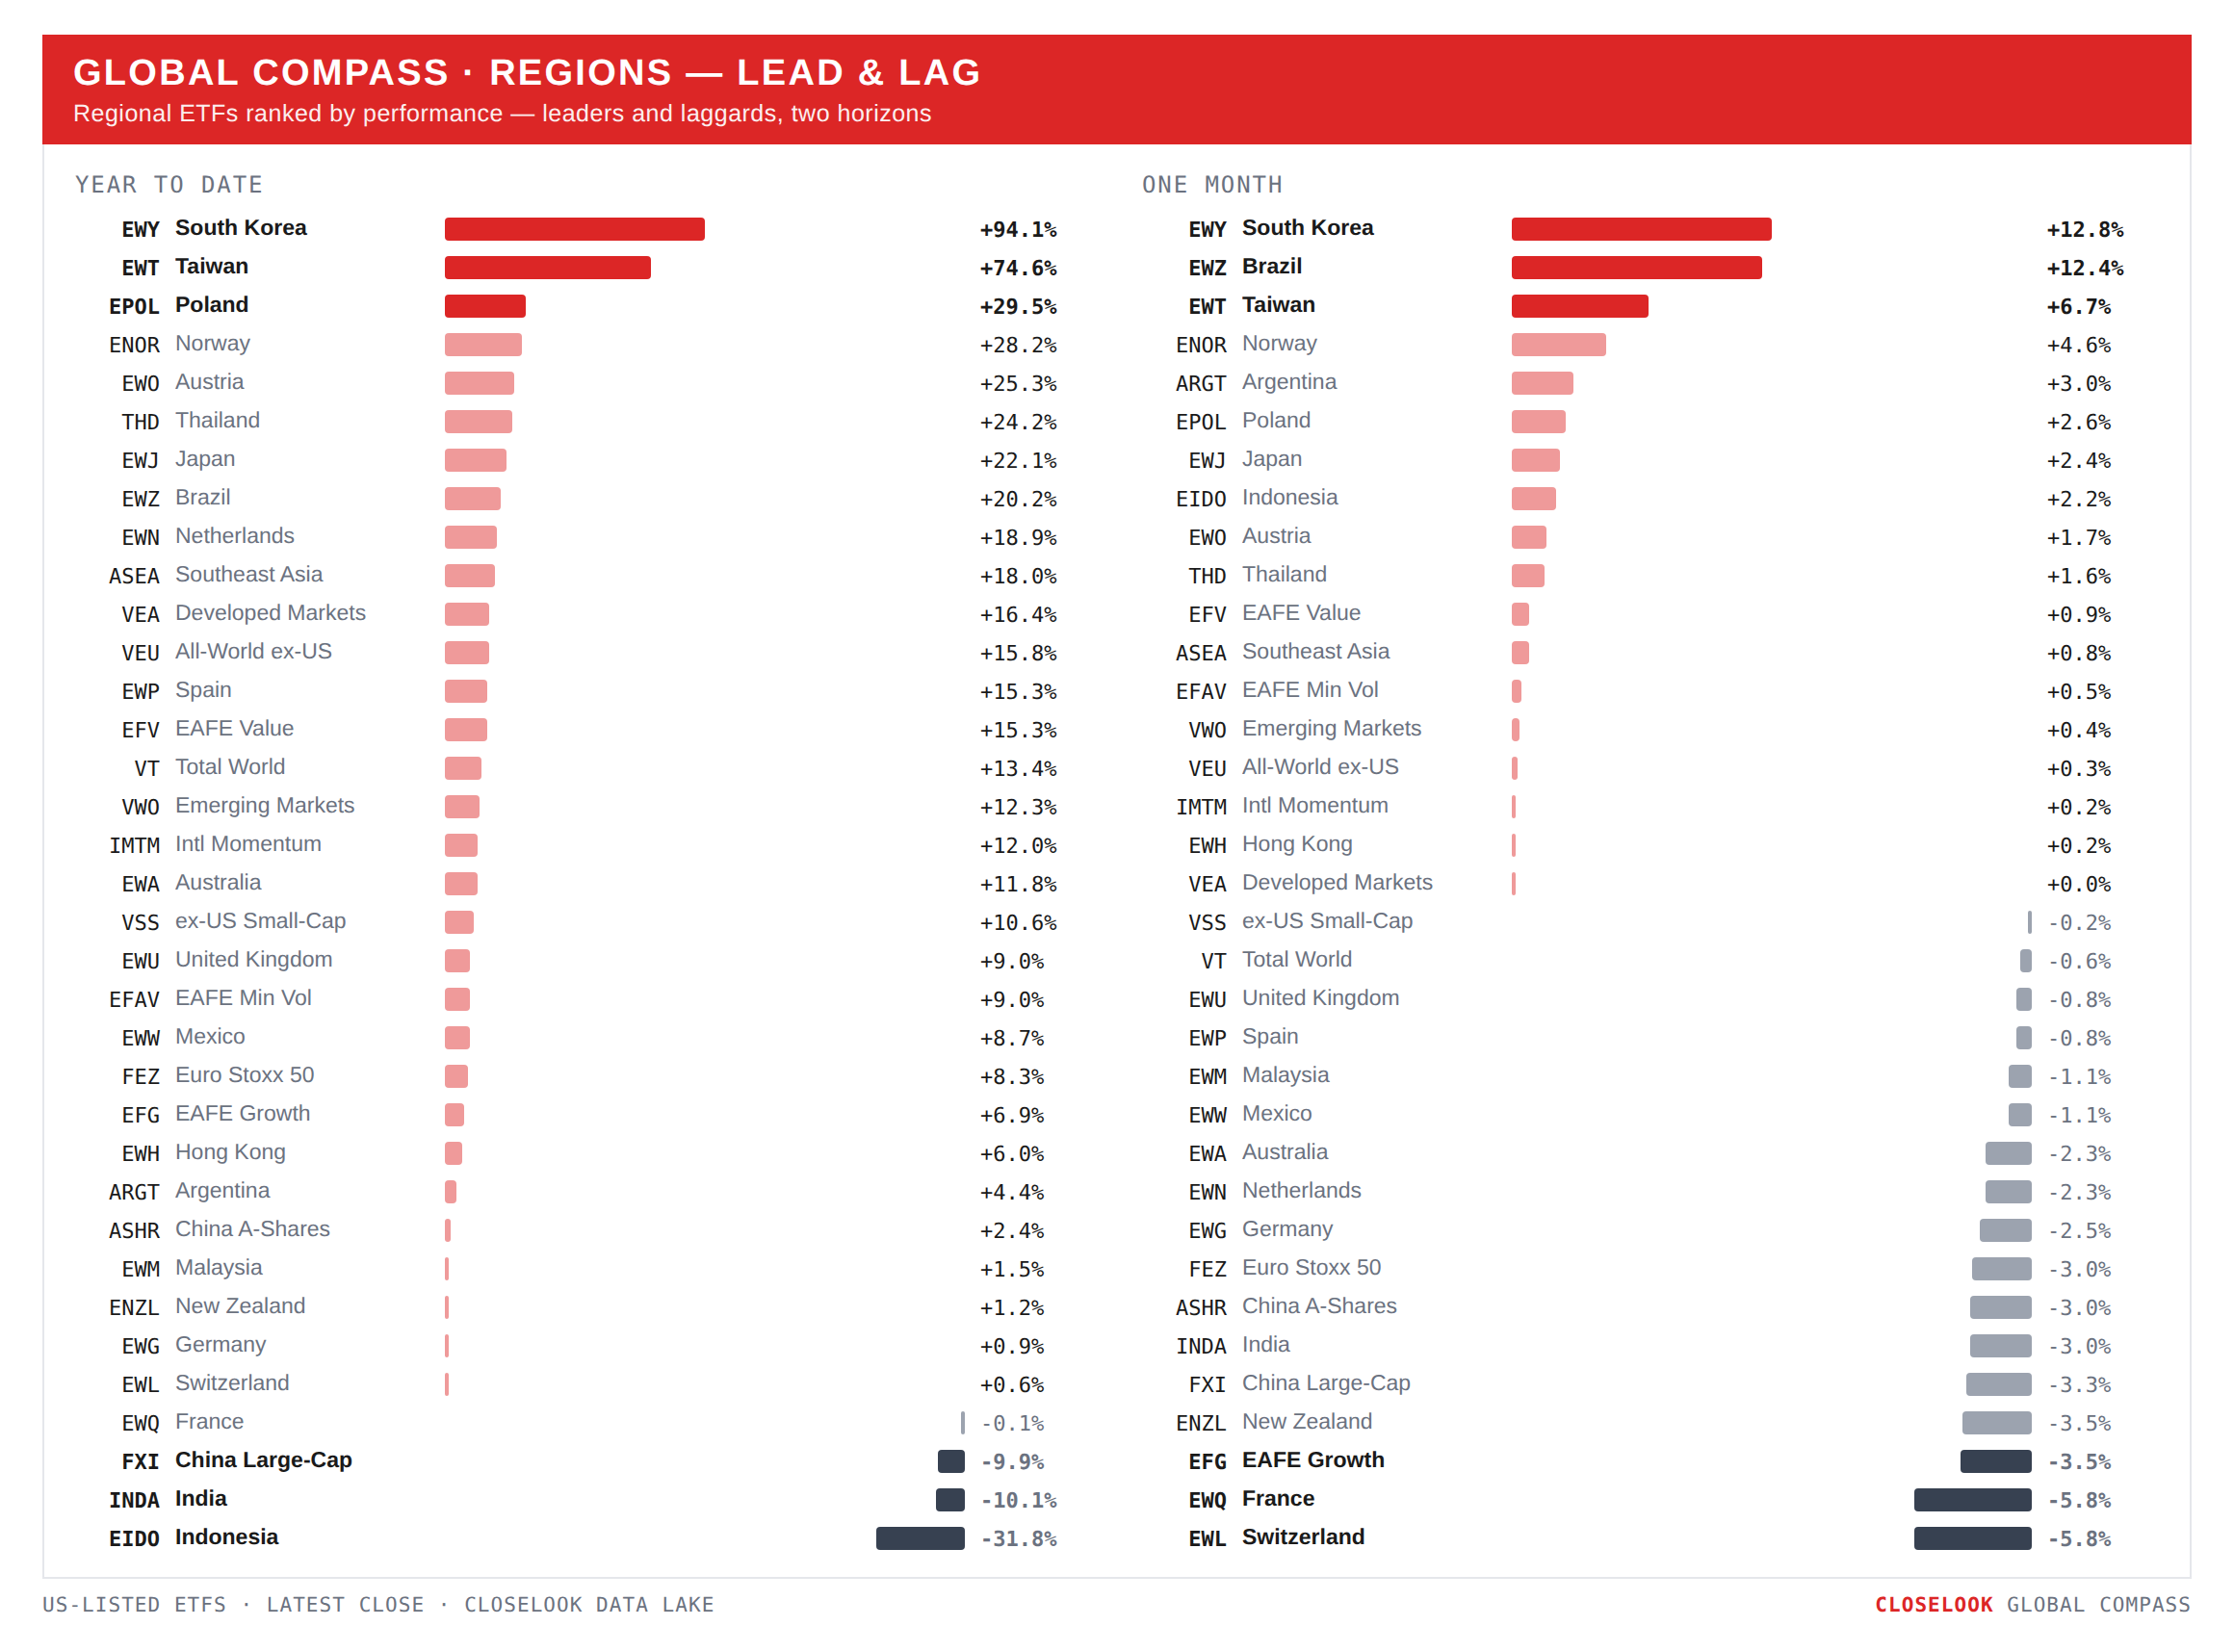
Regions: the corridor split, and developed beat emerging for the first time in four weeks. Emerging fell more than developed — VWO −1.77% against VEA −1.45% — after three straight weeks of EM leading, and the composition of the loss is the week's regional story: China large-caps −3.87%, India −2.68%, Indonesia −2.37%, Hong Kong −2.93% — the non-corridor half of EM — while the corridor split in two. Korea flat in dollars and +3.3% in won; Taiwan −1.13% in dollars and −0.8% in Taipei; Japan +0.28% in dollars to 98.56 — a new record close — and −1.55% on the Nikkei, −1.8% on the TOPIX. Japan made a record in the currency its wrapper reports in while falling in the currency its companies report in. The read this letter carried last week — the AI-supply-chain bid is cyclical inside a broadening market — got its counter-demonstration: when the market narrows, the corridor's dollar wrappers are held up by their currencies for exactly as long as the currencies rise. The won and the yen both rose this week. Section 7 says why that is the asterisk, not the answer.
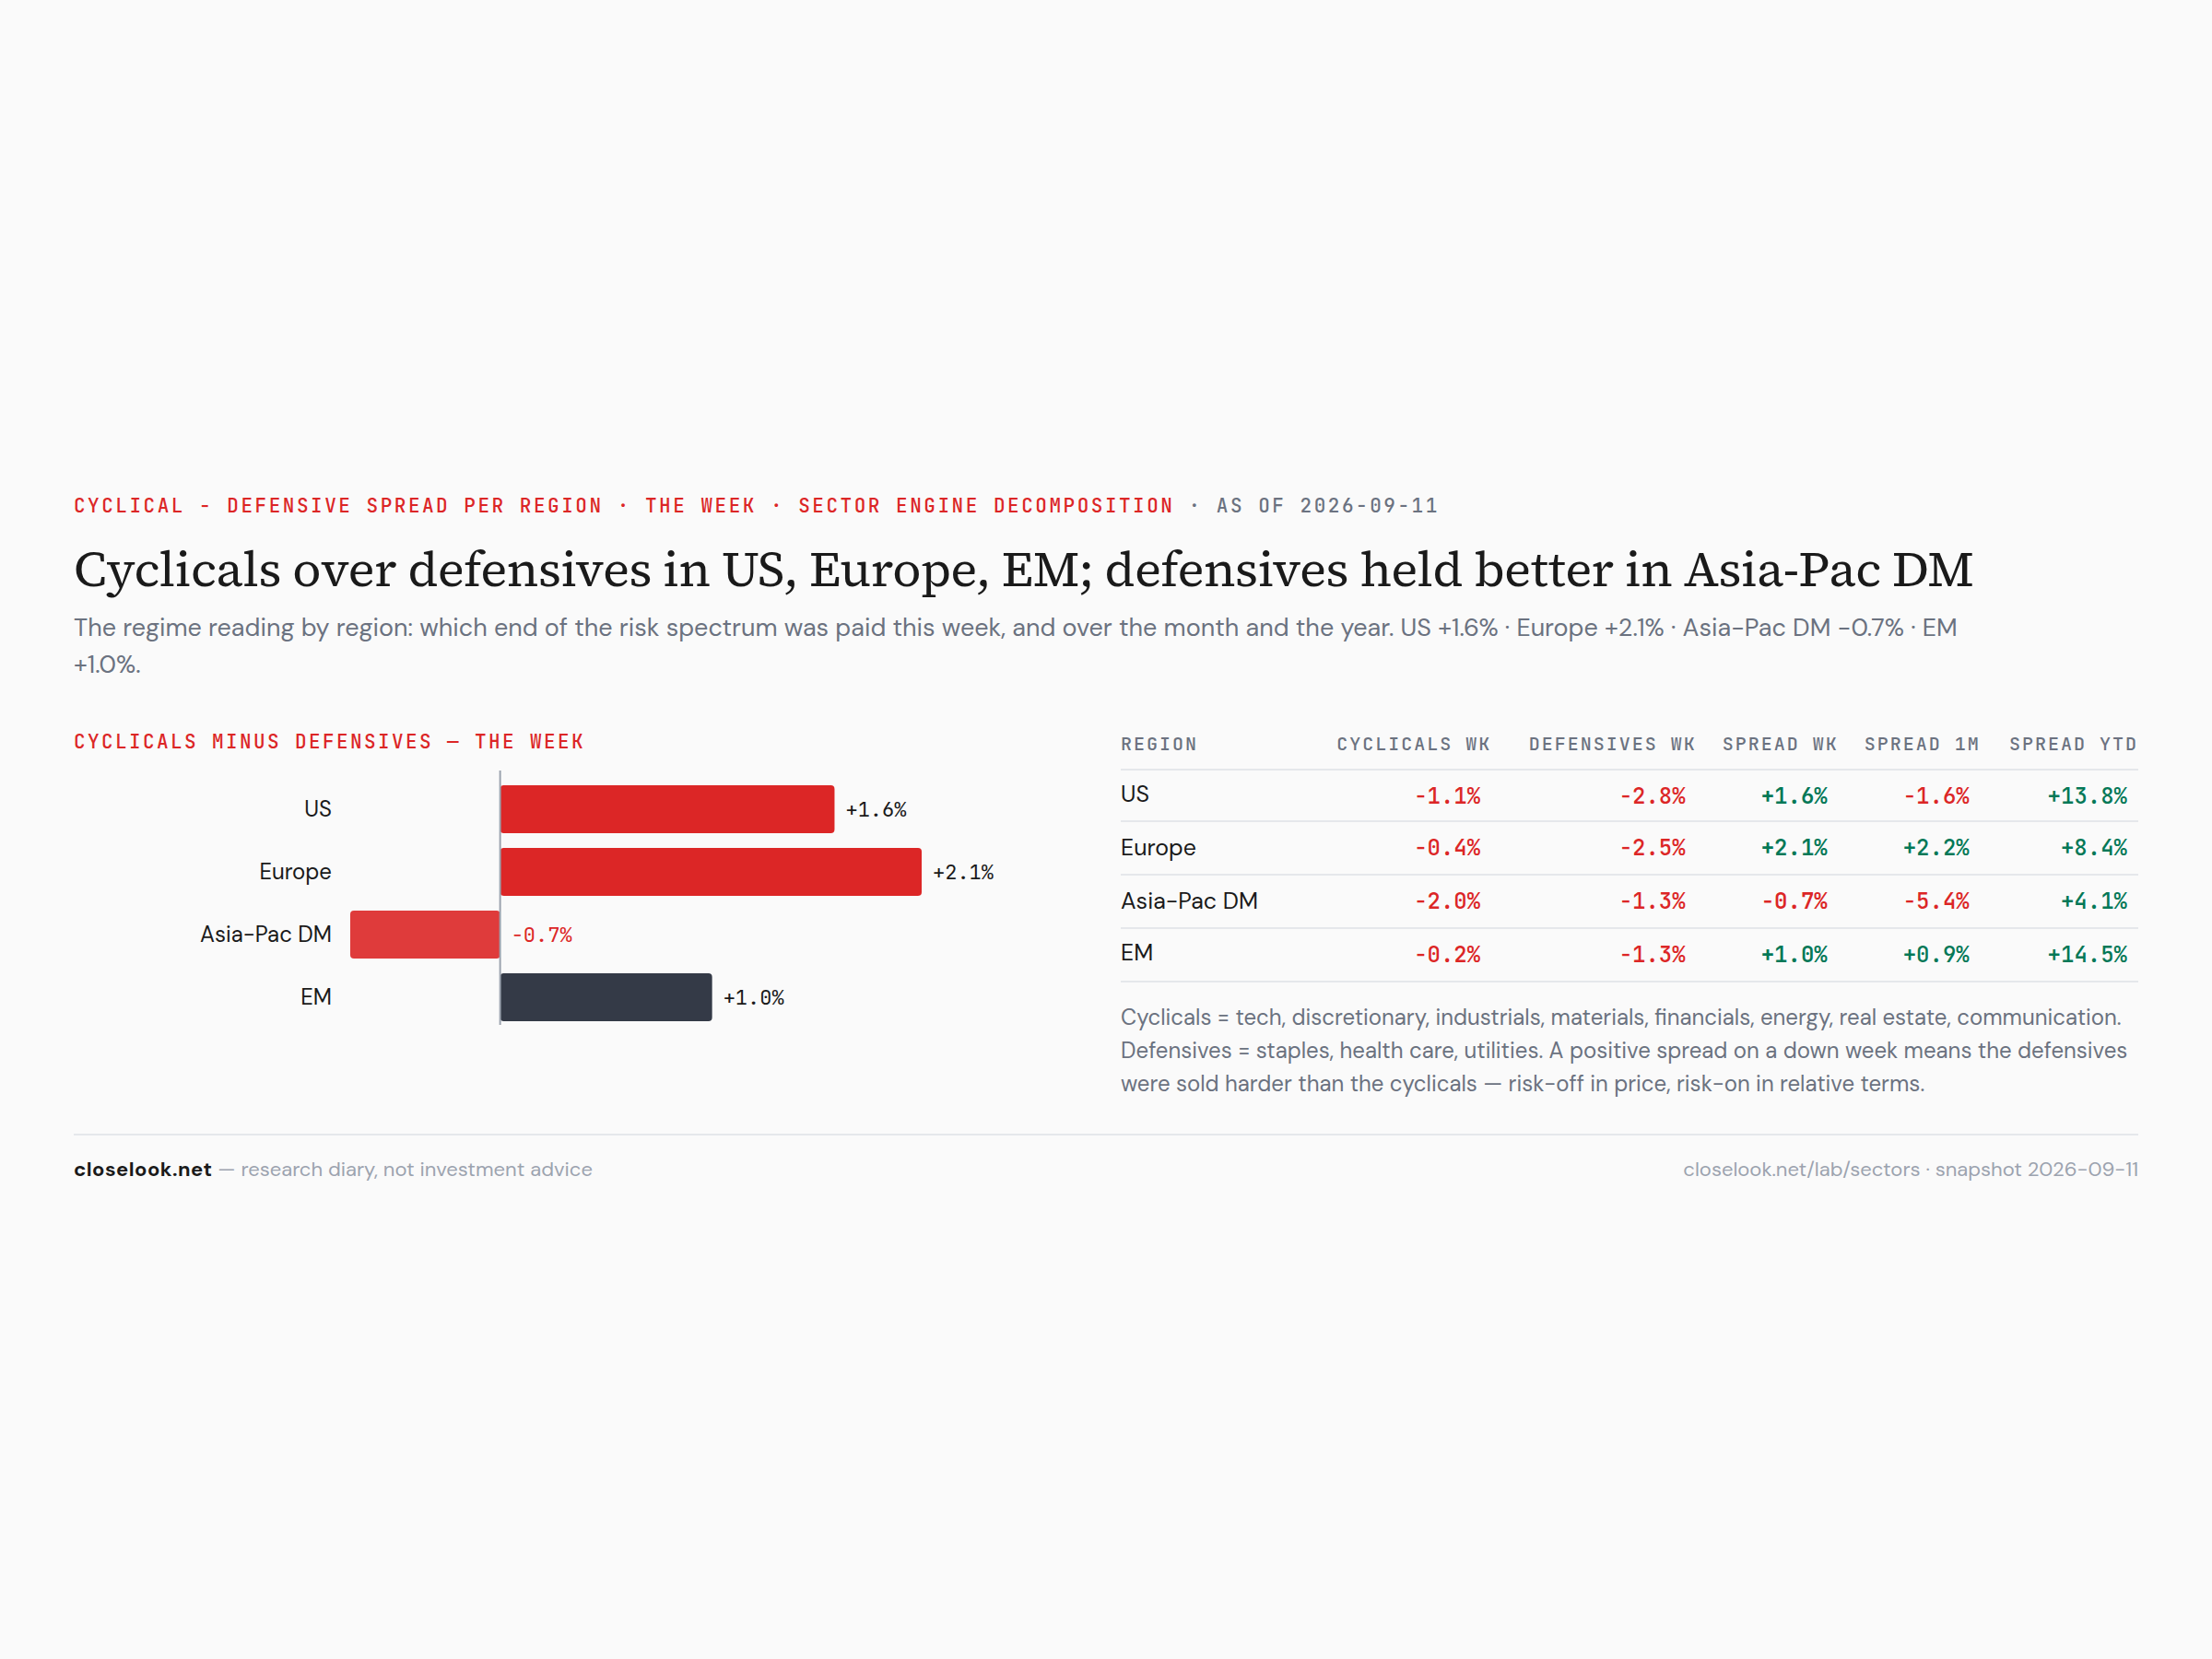
Sectors: the defensives were sold harder than the cyclicals, on a down week. The engine's cyclical-defensive spreads carry a sign this letter has not printed in a red week before: US +1.6% — cyclicals −1.1%, defensives −2.8% — and Europe +2.1% — cyclicals −0.4%, defensives −2.5%. Developed Asia was the exception again, −0.7%, the cyclicals down two percent against the defensives' −1.3%. In price the week was risk-off; in relative terms it was risk-on, because the sectors that lost most were the ones that are supposed to lose least. Health care −4.6% in the US and −5.5% in Europe is what did it. That is not a rotation reading. It is a liquidation reading: the groups with the most gains to sell were sold, whatever their beta.
Sectors: the leaders' bench cleared a line, held it a day, and gave it back — twice now. Three editions of materials read led, lagged, led-to-a-record, un-cleared. Two editions of financials: "one green day from its record," then the record on Thursday September 3, then 134.23 this Friday, under the 134.55 line it had cleared to get there. Technology −0.13% and 4.7% under its June high; energy +2.16%, the barrel +124% on the year and the sector +42%; industrials −1.14%, 5.7% under its August high. A board where the closest challenger takes its record and gives it back within a week, and the previous challenger did the same thing three weeks earlier, is a board that can clear lines and cannot hold them. Last week this letter said that question had been open since materials first asked it. It is answered now, twice, the same way.
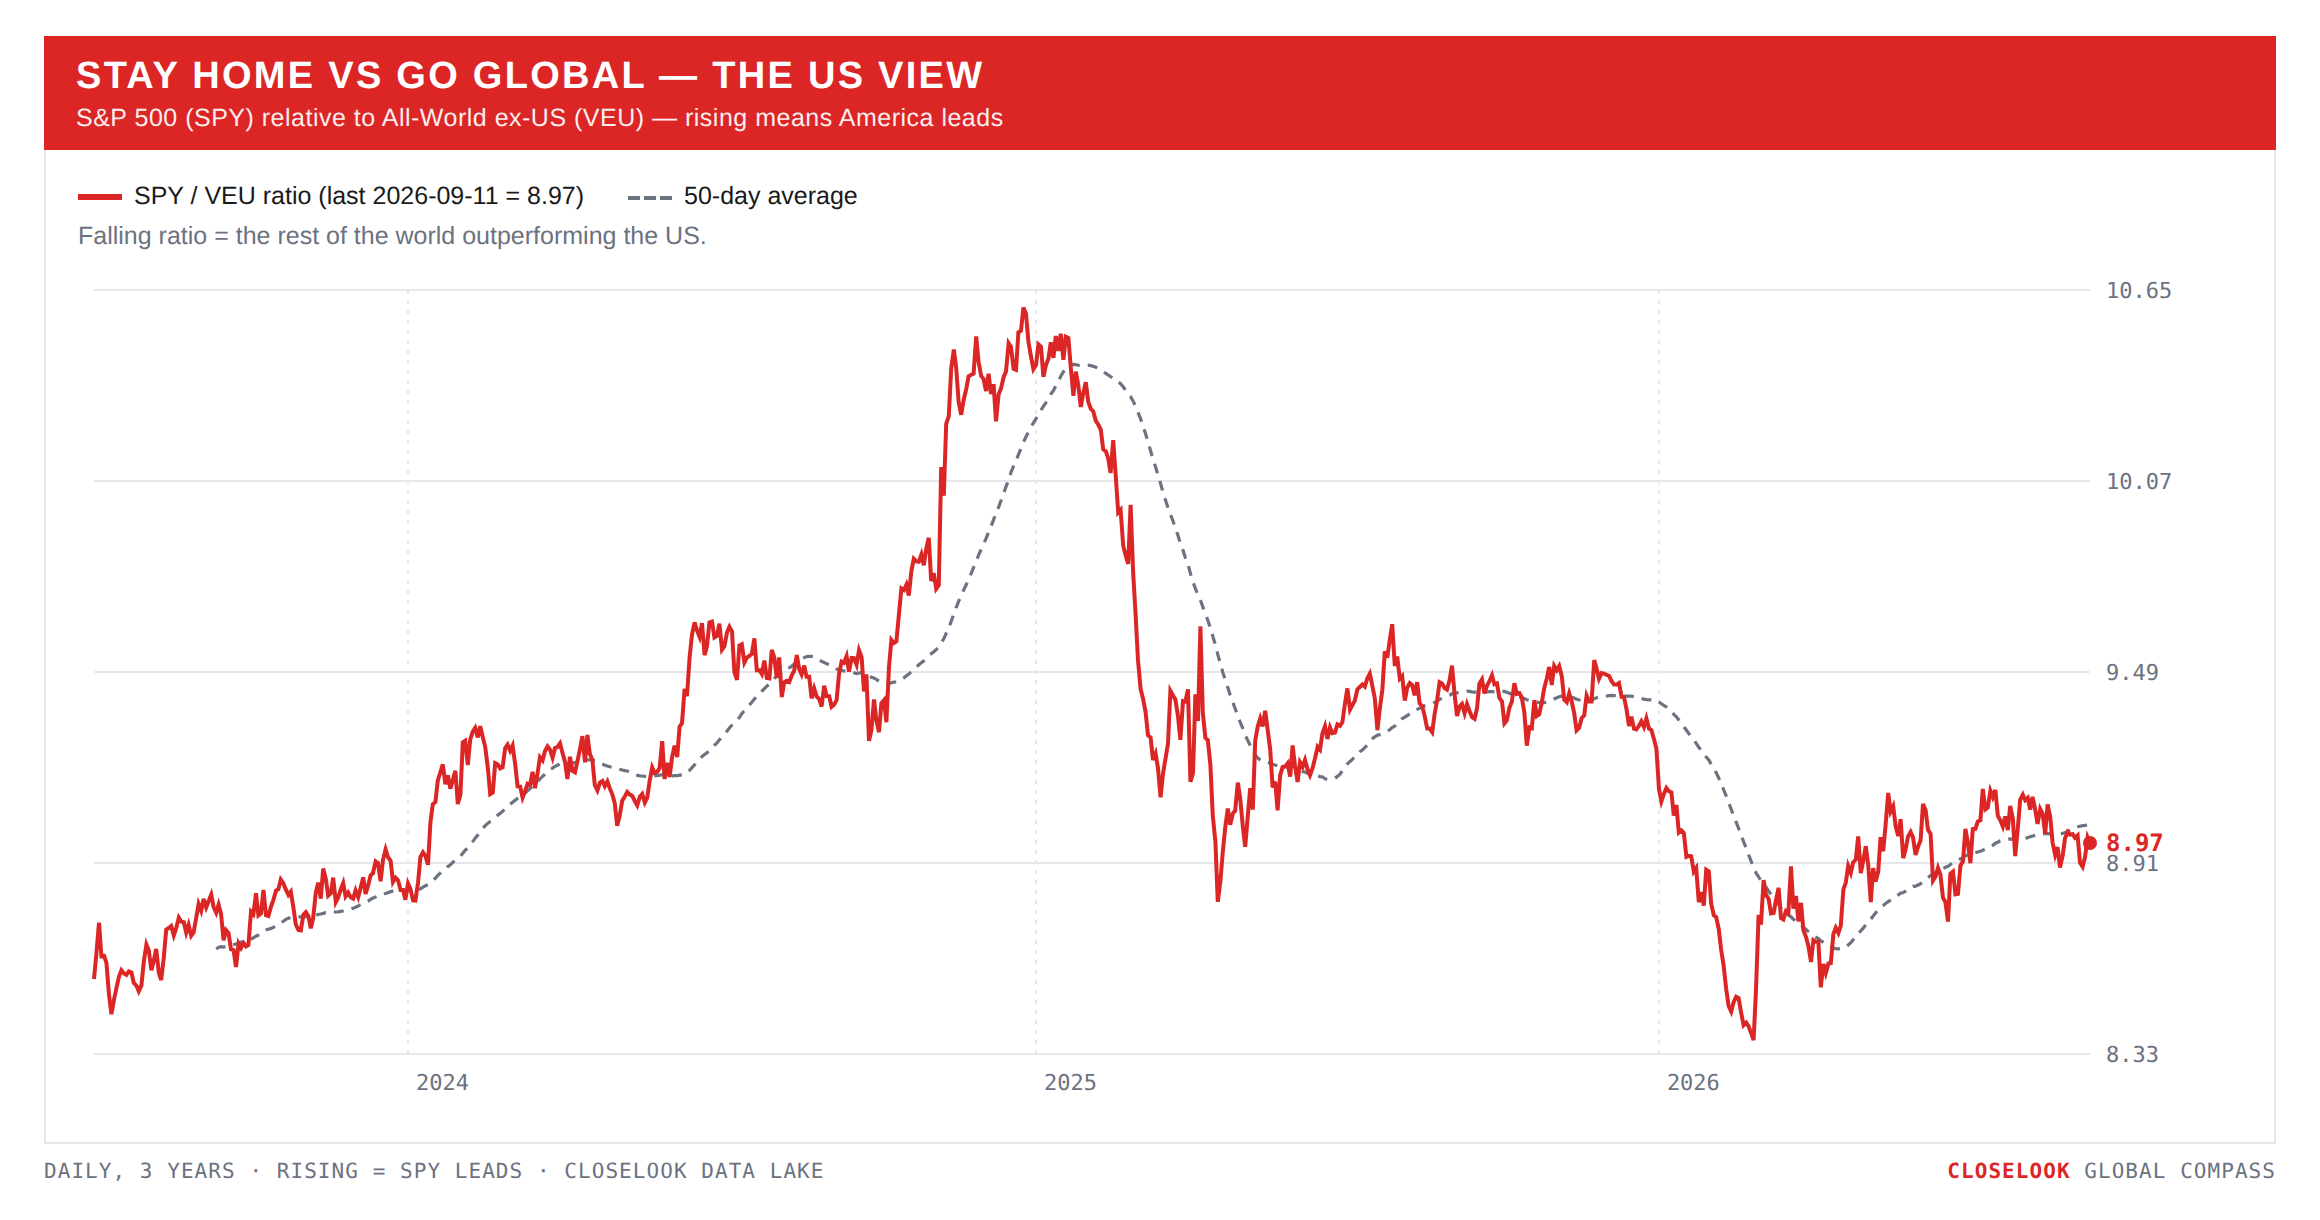
Stay home vs go global — the US view. America lost less: VEU −1.42%, VT −1.11%, SPY −0.77% — the first stay-home week in two, and it came the week the world index gave back its record. The year reads the other way and still comfortably: +15.8% against +13.4% against +12.1%, ex-US ahead by 3.7 points, from 4.5. Both readings, both honest: the trend is intact, the week went against it, and the weekly closes on VEU's board are what decide which one is the signal — 86.41 the record, 86.08 the old one, and 85.23 now above the price, five cents above it, which makes it a line to reclaim rather than a line to hold.
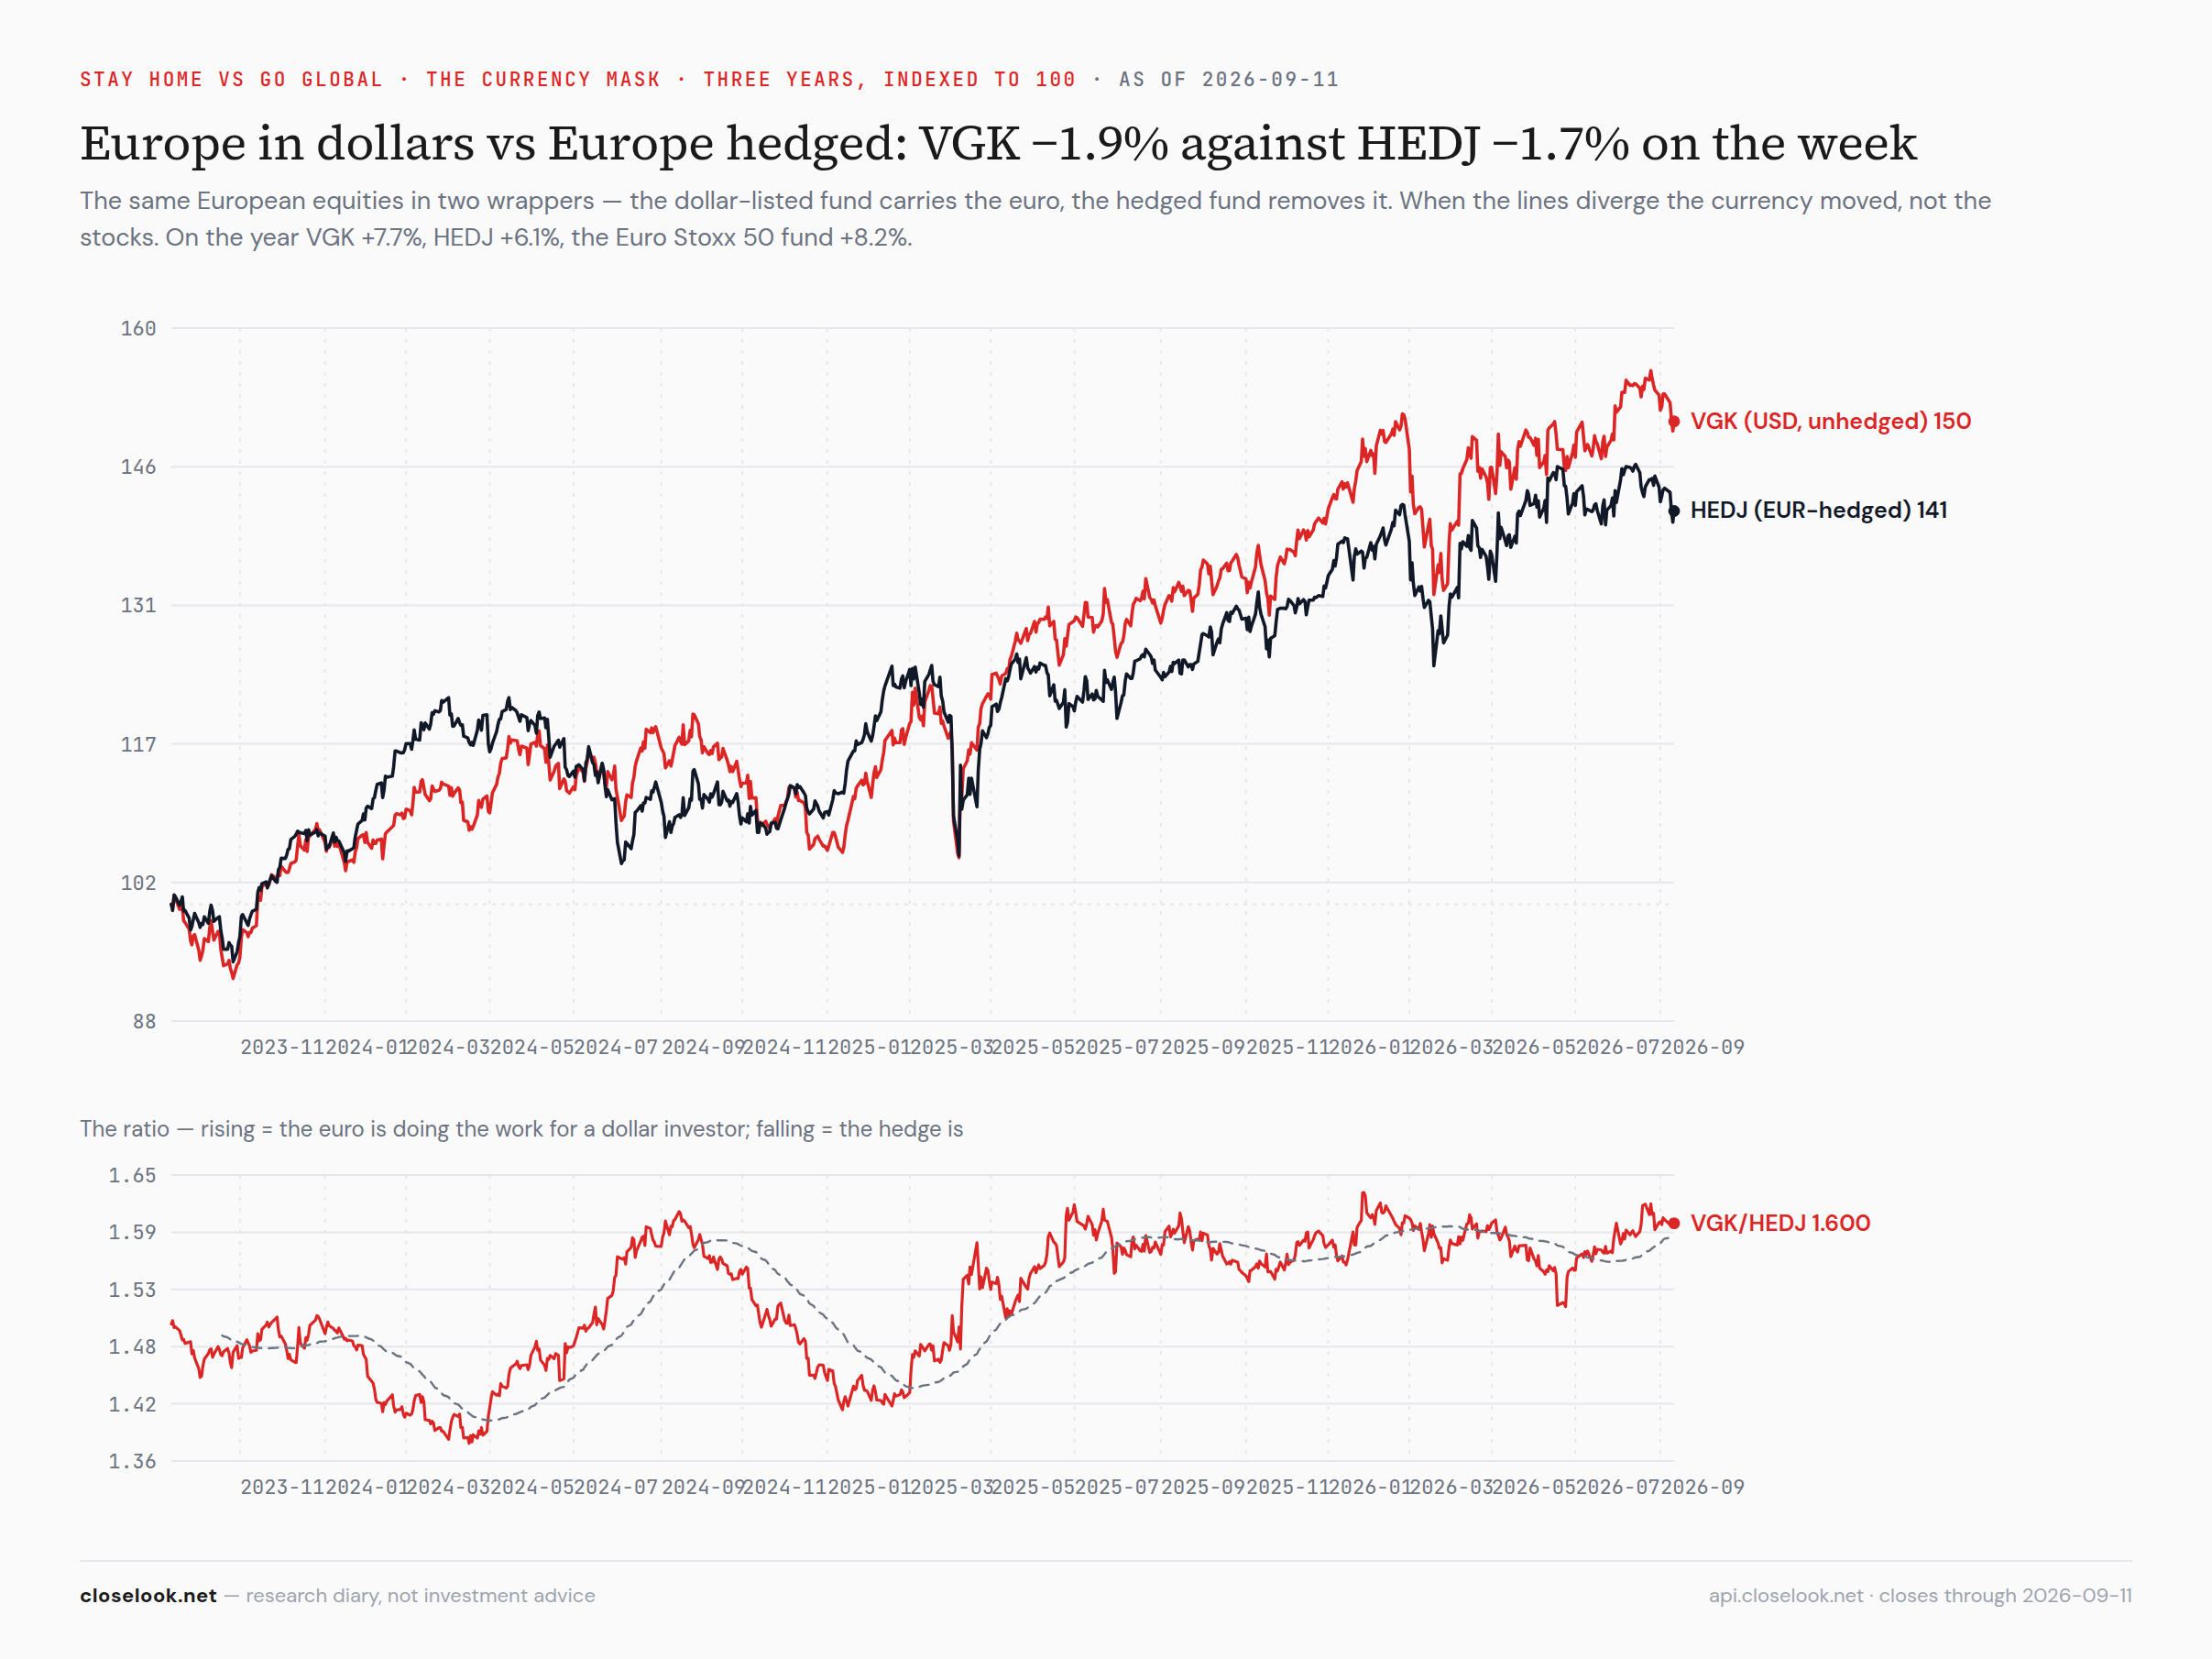
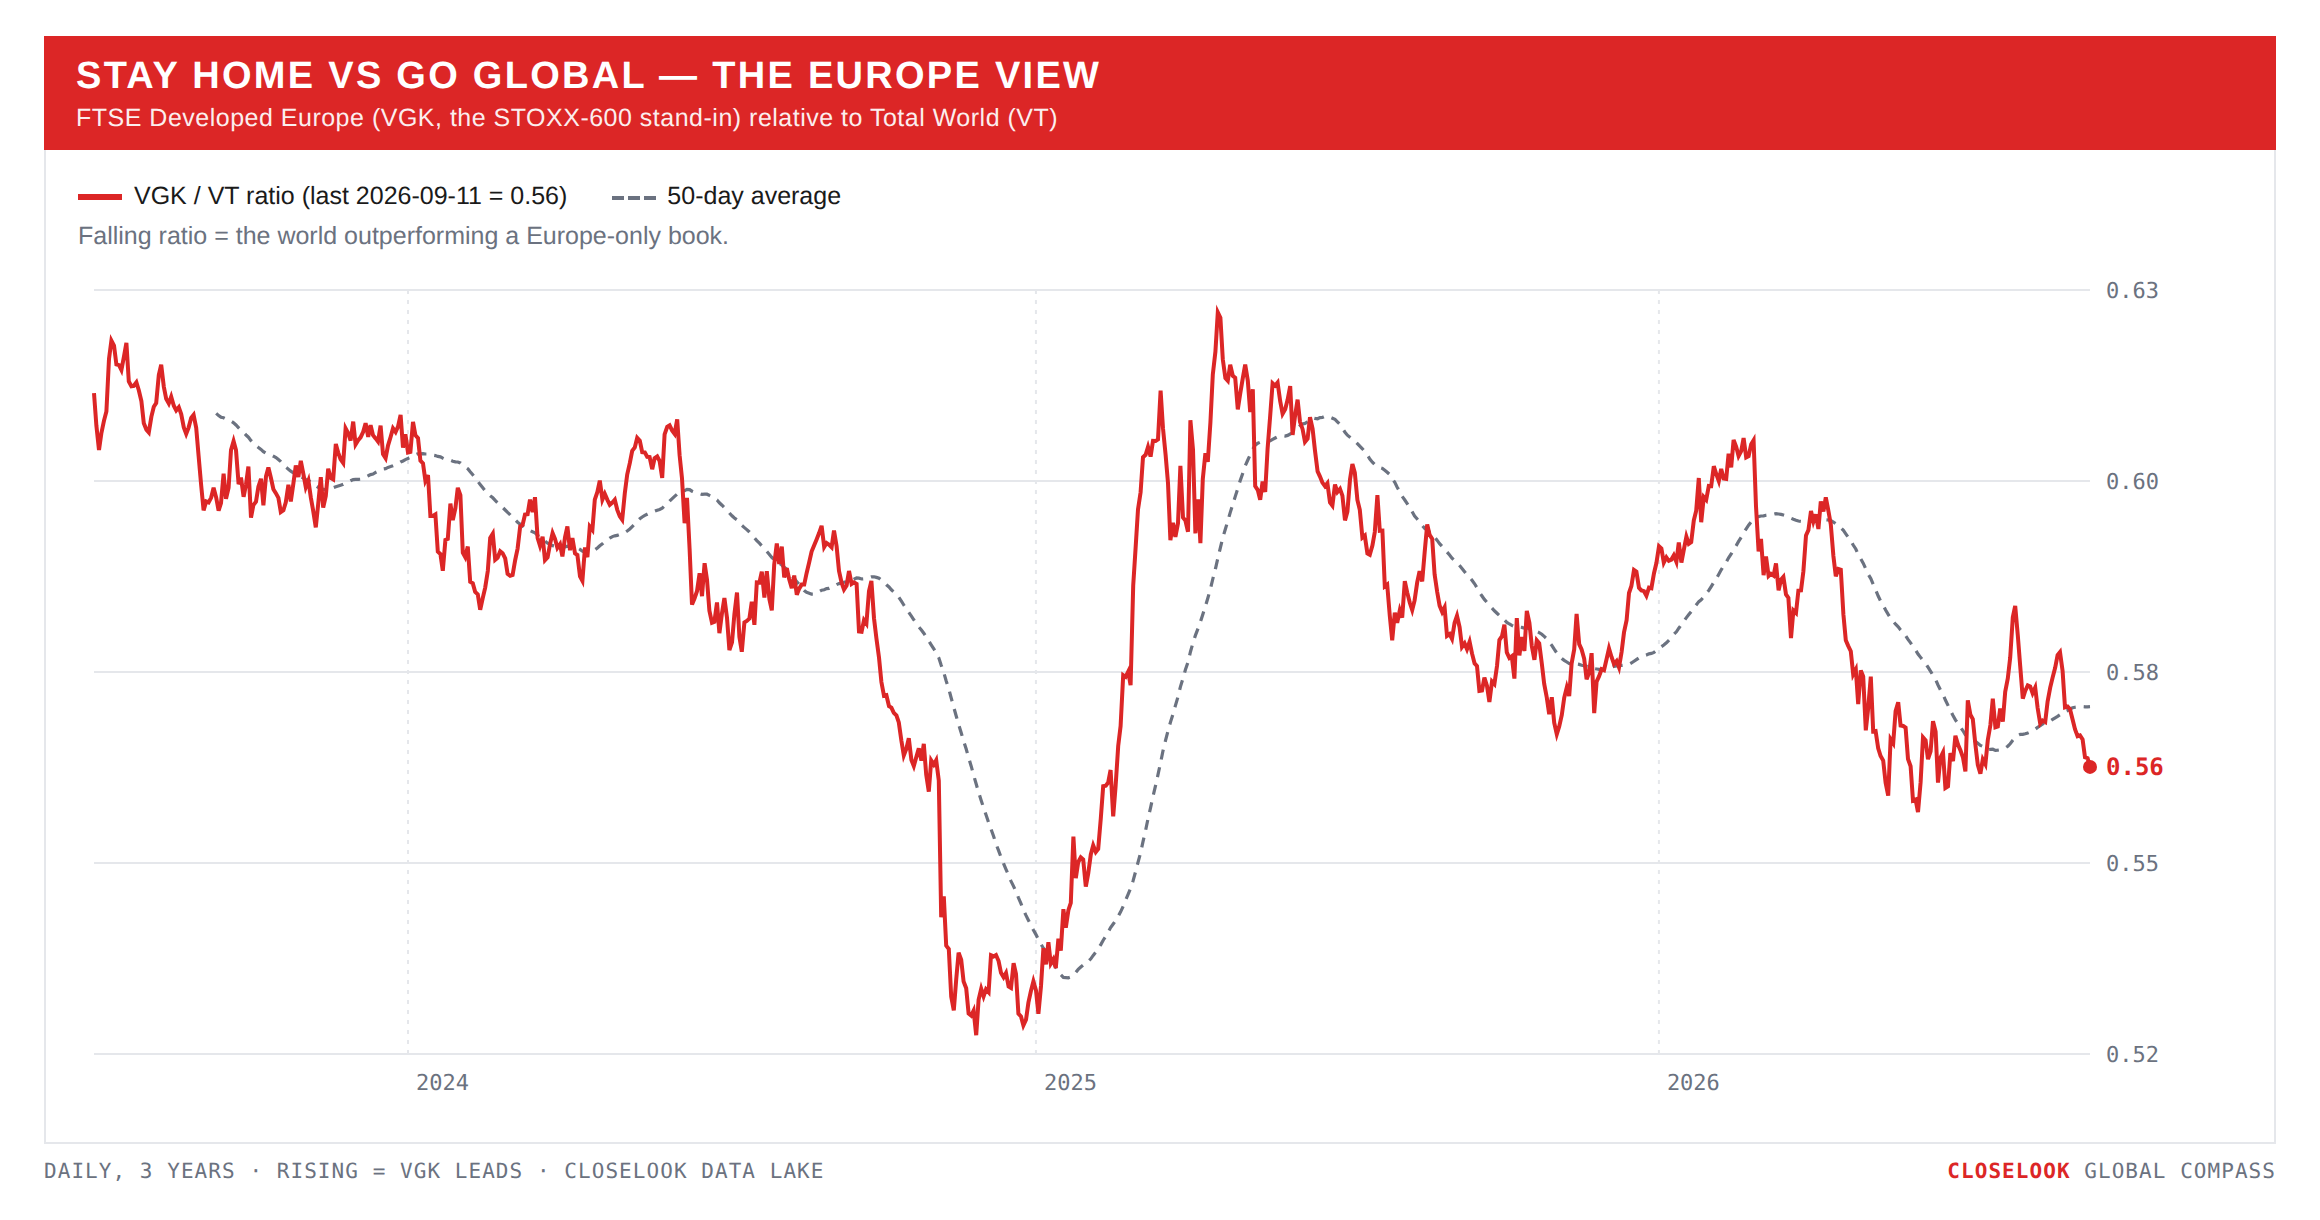
Stay home vs go global — the Europe view: the mask flipped a fourth time. Last week the dollar wrapper fell less than the hedged one because the euro was bid. This week the euro slipped a fifth of a percent and the dollar-listed Europe fund fell 1.87% while the euro-hedged wrapper fell 1.66% — the currency was the worse half by a hair, the equities the story. Underneath: Germany −2.32% in dollars, the DAX −2.0% in euros, from 26,046 to 25,519; the Stoxx 600 −1.7%; the Euro Stoxx 50 −1.1%; France −1.66%; the UK −1.34%; and Switzerland −4.48% — the SMI's worst week of the summer, −4.05% in francs, health care's home index. And the bond market moved harder than the stock market: the Bund's ten-year yield closed the week at 3.52%, up 17 basis points from 3.35%, after the ECB raised its deposit rate to 2.50% on Thursday — unanimously, Lagarde's "no-brainer," the second hike of the war — and France borrowed at 4.45% against Italy's 4.35%: the inversion is ten basis points now, from six. The gilt 5.28%. Europe's two core markets pointed the same way last week. This week the periphery joined them, and the Swiss defensives went first.
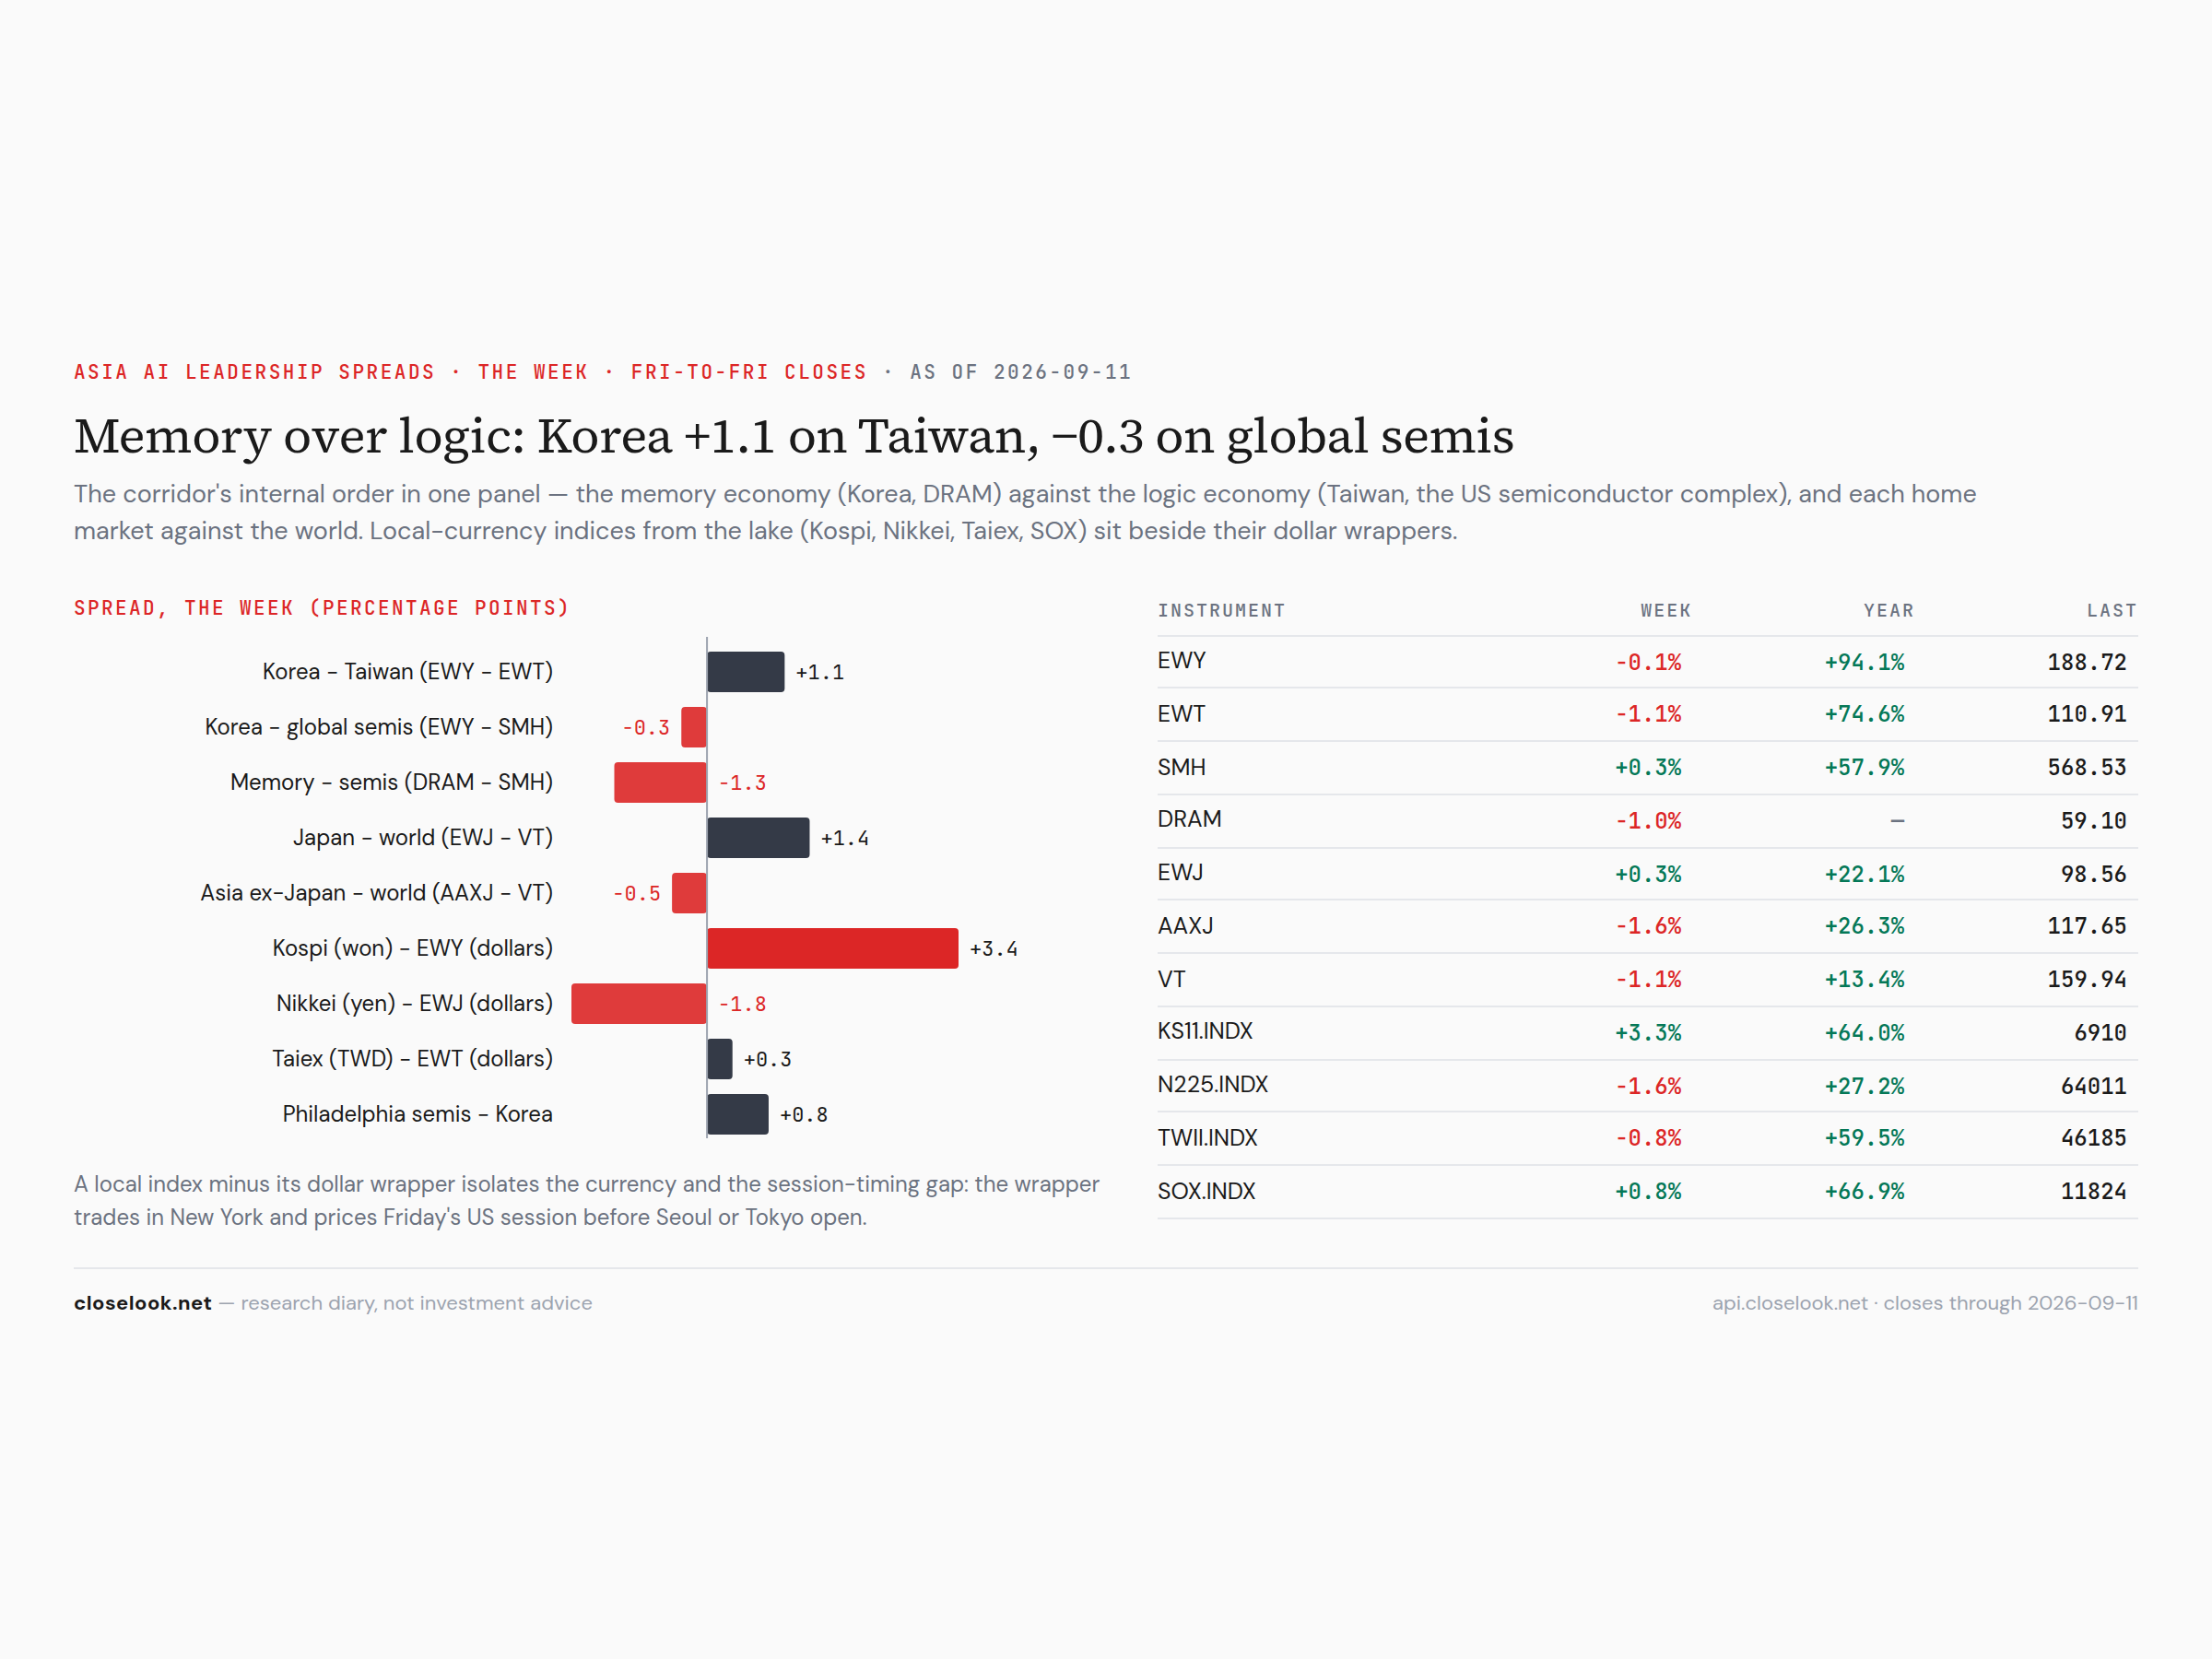
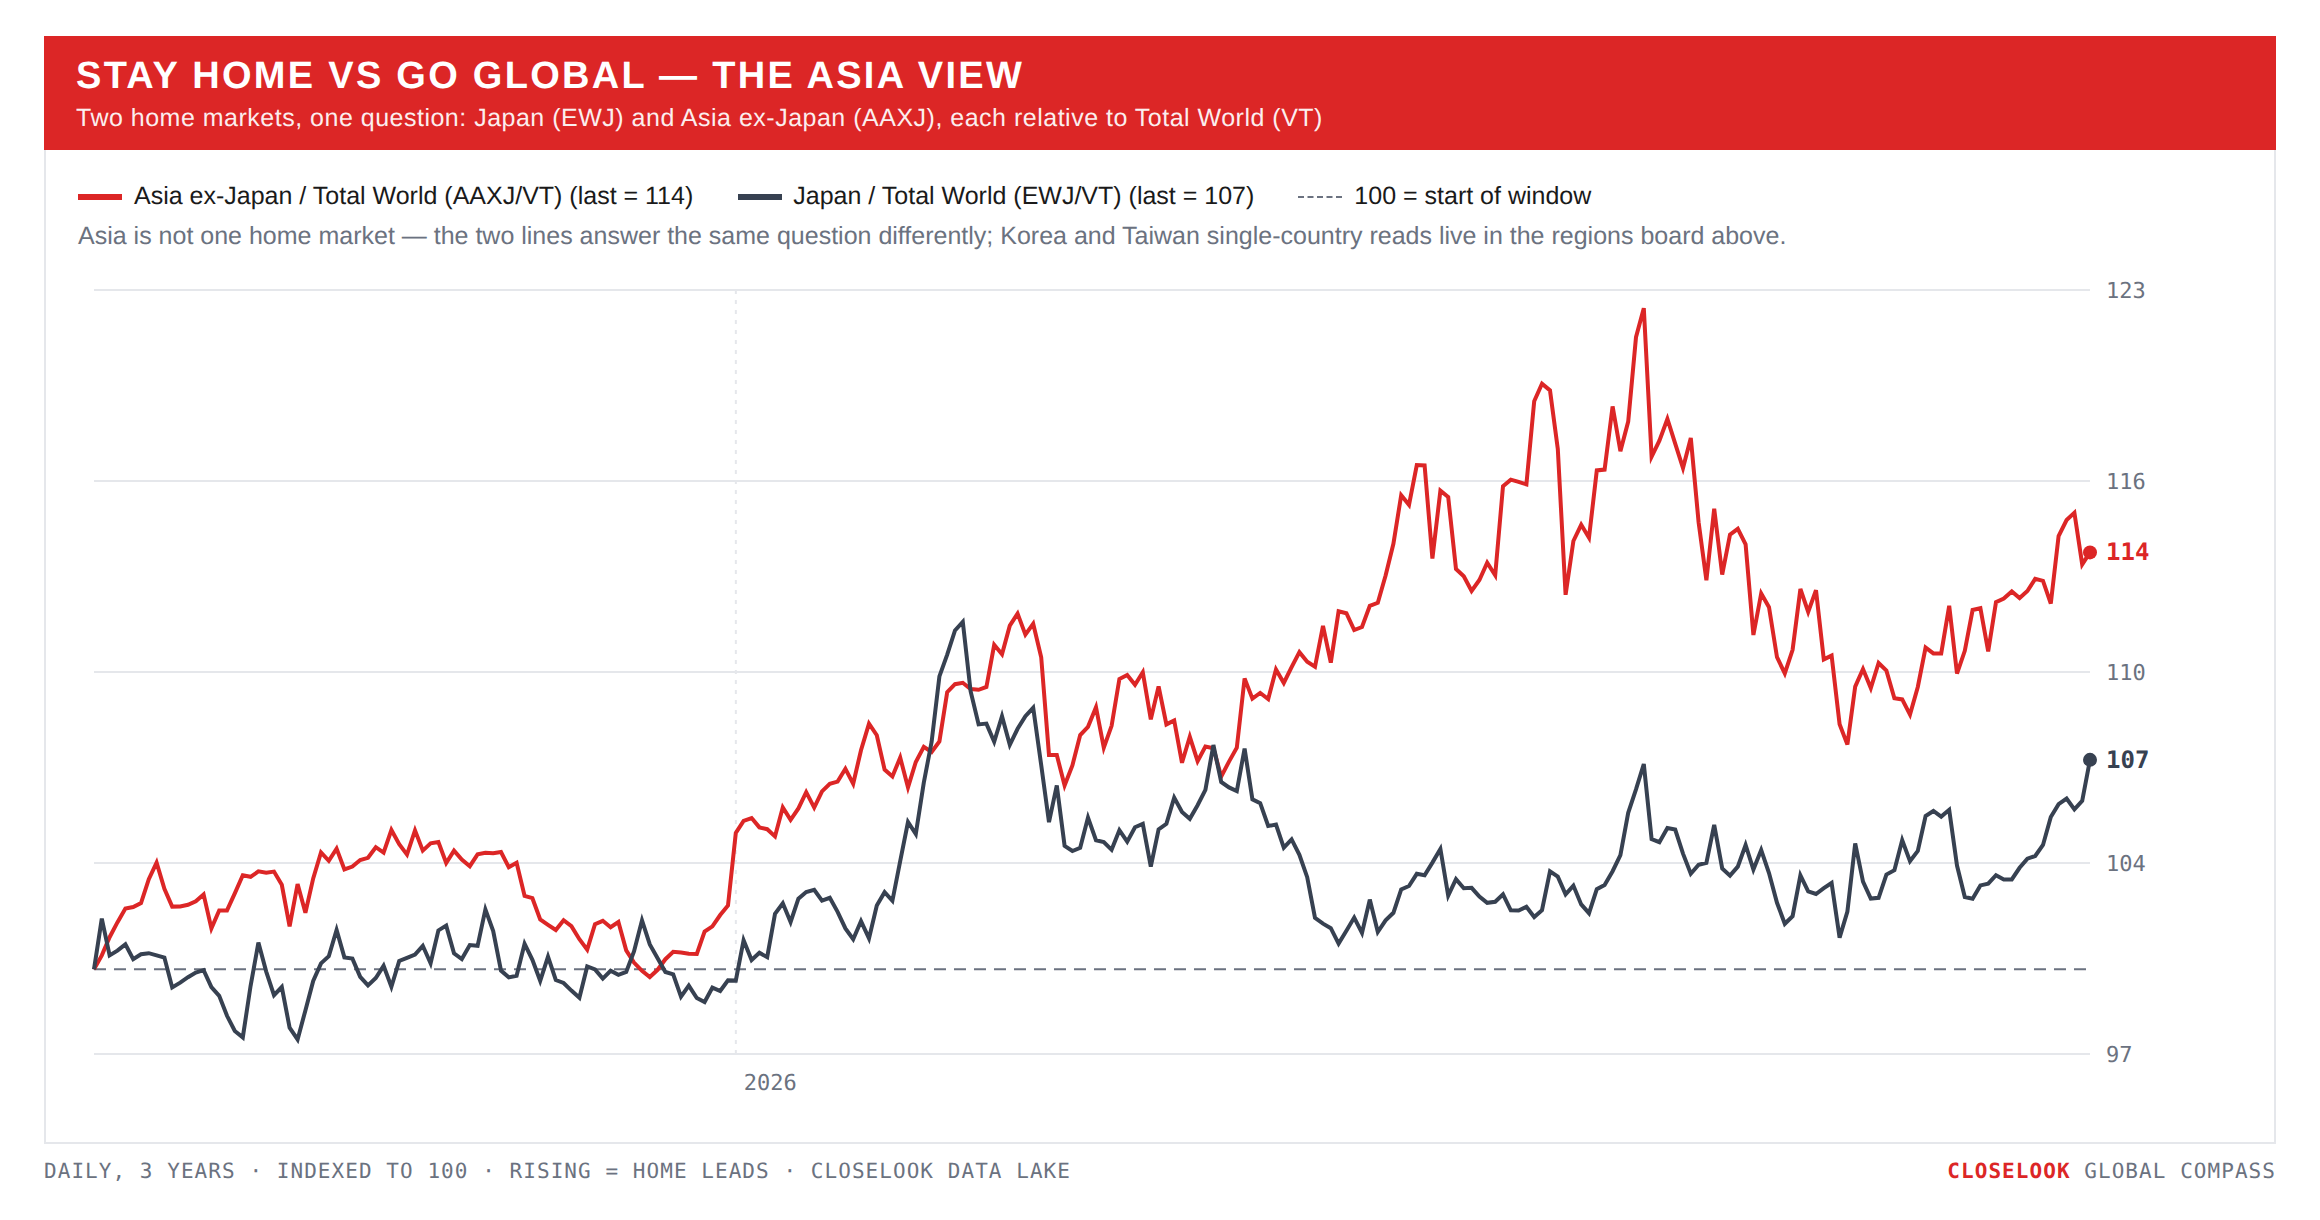
Stay home vs go global — the Asia view: the corridor was three markets this week. Last week the corridor answered twice in one direction. This week it answered three ways. Japan: a record close in dollars at 98.56, up 0.28%, on a week the Nikkei fell 1.55% from 65,021 to 64,011 and the TOPIX 1.8% — because dollar-yen fell from 155.66 to 153.55, the yen's strongest level in seven months, past the peak of July's intervention. Korea: +3.3% in Seoul, flat in New York, for the timing reason above; the local market touched 7,172 on Tuesday, closed 6,910 on Friday, under 7,000. Taiwan: −1.13% in dollars, −0.8% in Taipei, 110.91 from the 112.18 record set on September 4, after Thursday's 108.92 — the corridor's logic economy sold with the US chip leaders on Thursday and bought back less on Friday. Korea over Taiwan +1.1 points on the week; Korea over global semis −0.3. Memory over logic held; the corridor over the world did not. The re-rating question from July stays answered in price for Korea and Japan. The asterisk is now two currencies wide.
The engine's Asia spreads put the wrapper-versus-home gap on one panel: Kospi minus EWY +3.4 points, Nikkei minus EWJ −1.8 points, Taiex minus EWT +0.3. The memory vehicle, DRAM, fell 0.99% to 59.10 — 61.58 on Wednesday, 58.56 on Thursday, and above the 58 line on every close of the week. Last week memory diverged from its region's confirmation and then closed the gap in memory's favour; this week memory held while the region's wrappers gave ground. Two weeks of memory leading logic, and section 3's Rubin sub-indices say which physical layers were bought with it.
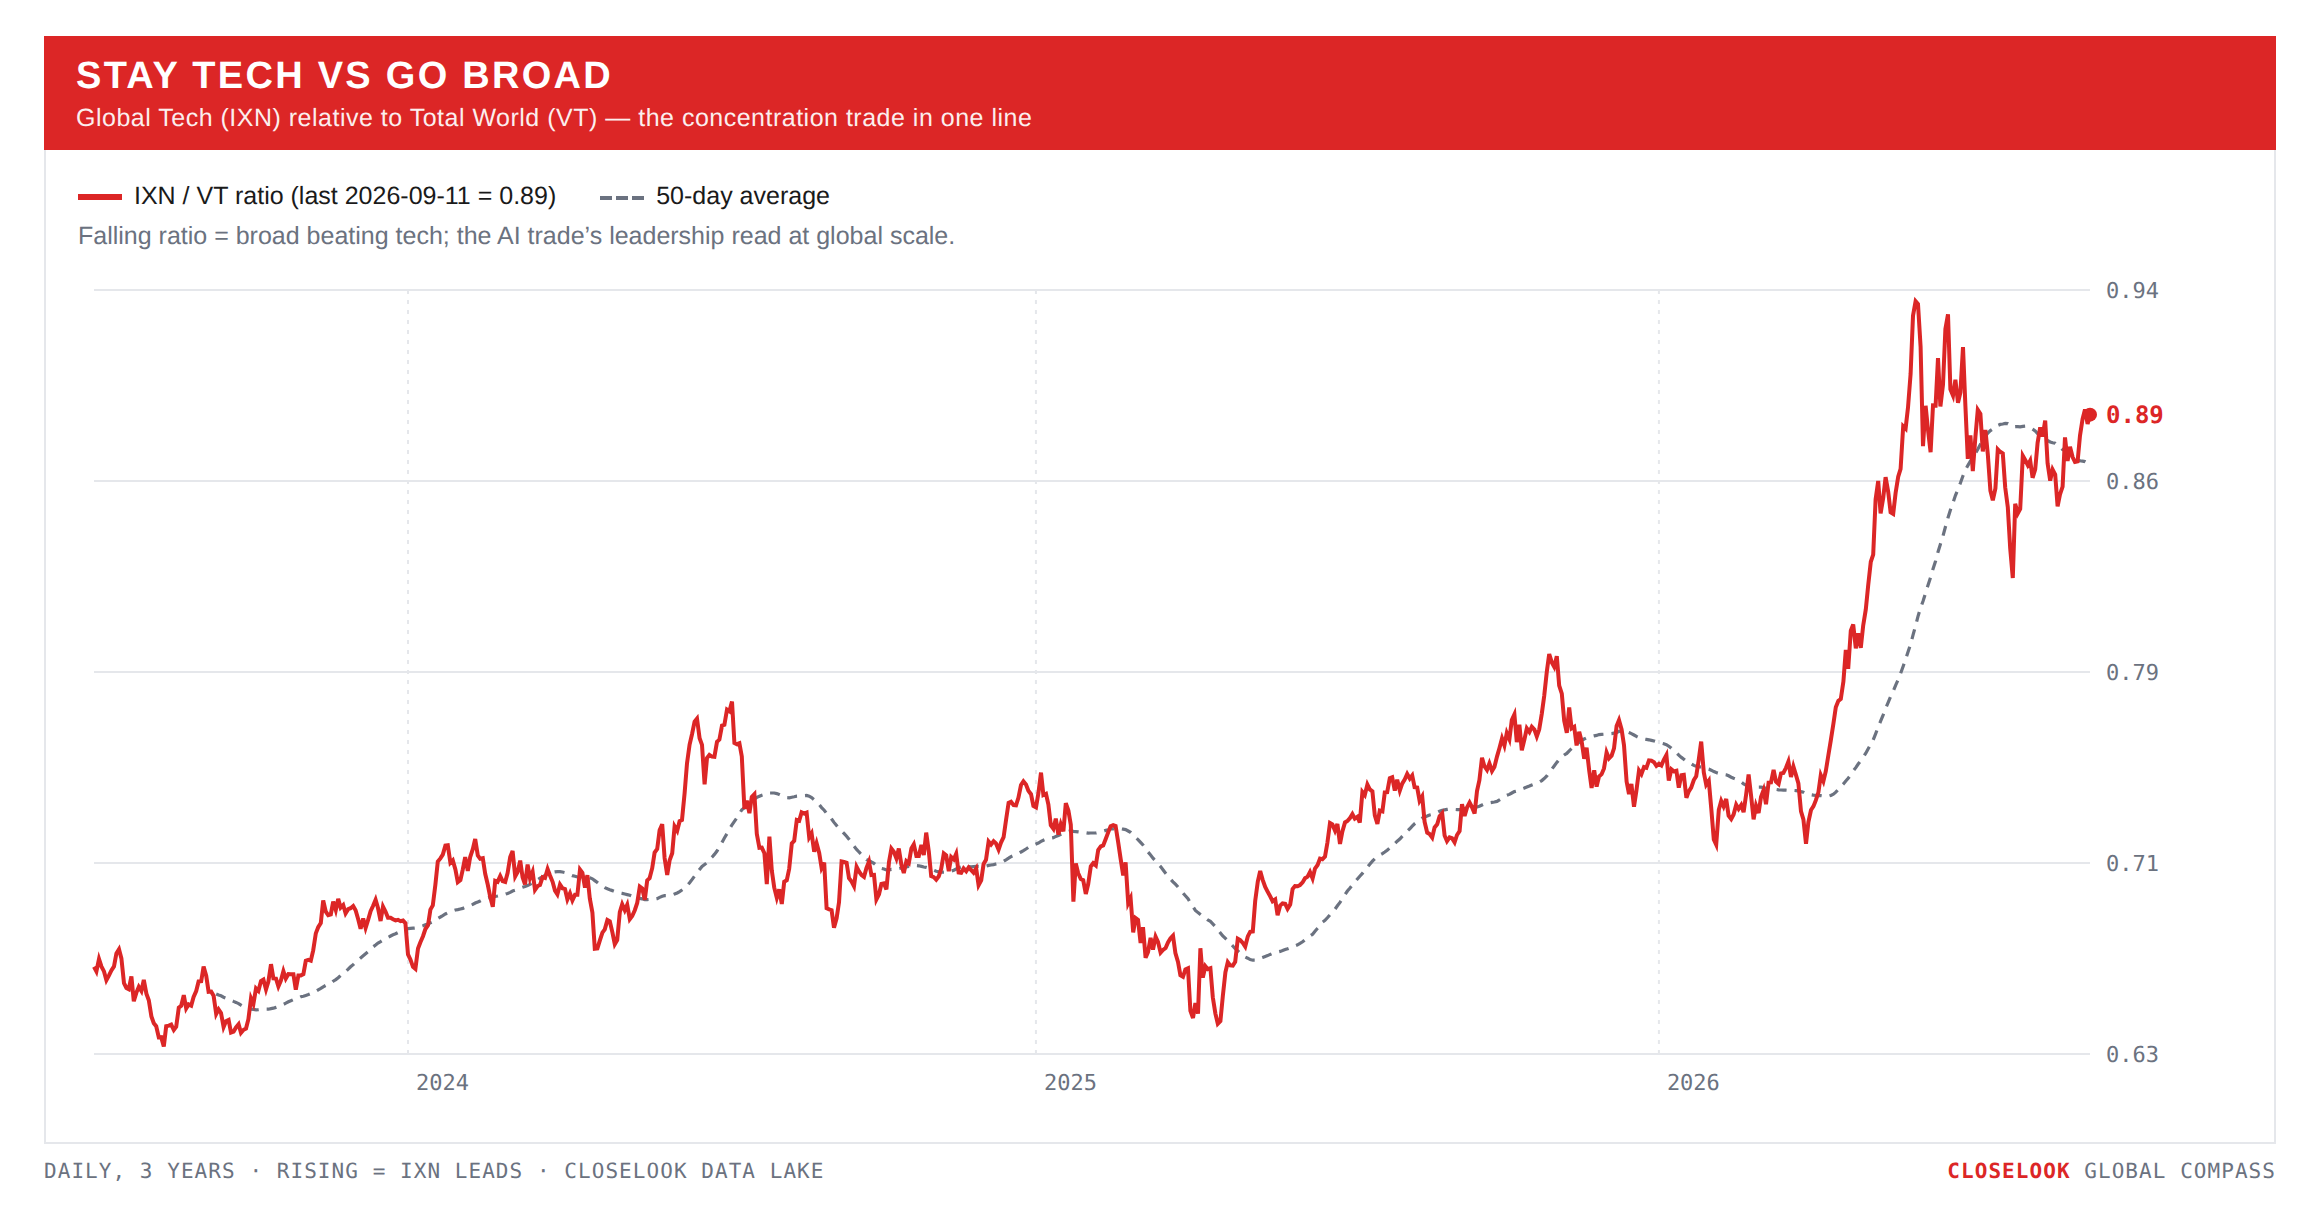
Stay tech vs go broad. Tech led by losing less, at home and abroad. The Nasdaq 100 −0.57% against the S&P's −0.77%; global tech −0.13% against the world's −1.11%. Technology the third-best US sector and the third-best global sector; the equal-weight semis the best tech line, software among the worst. Tech led the way it led last week — by its silicon — but the aggregate went negative this time because the chips' gain was smaller than the code's loss and the biggest chip fell 4.45%. Same direction inside the stack, a weaker aggregate: the week the leadership narrowed inside the leader.
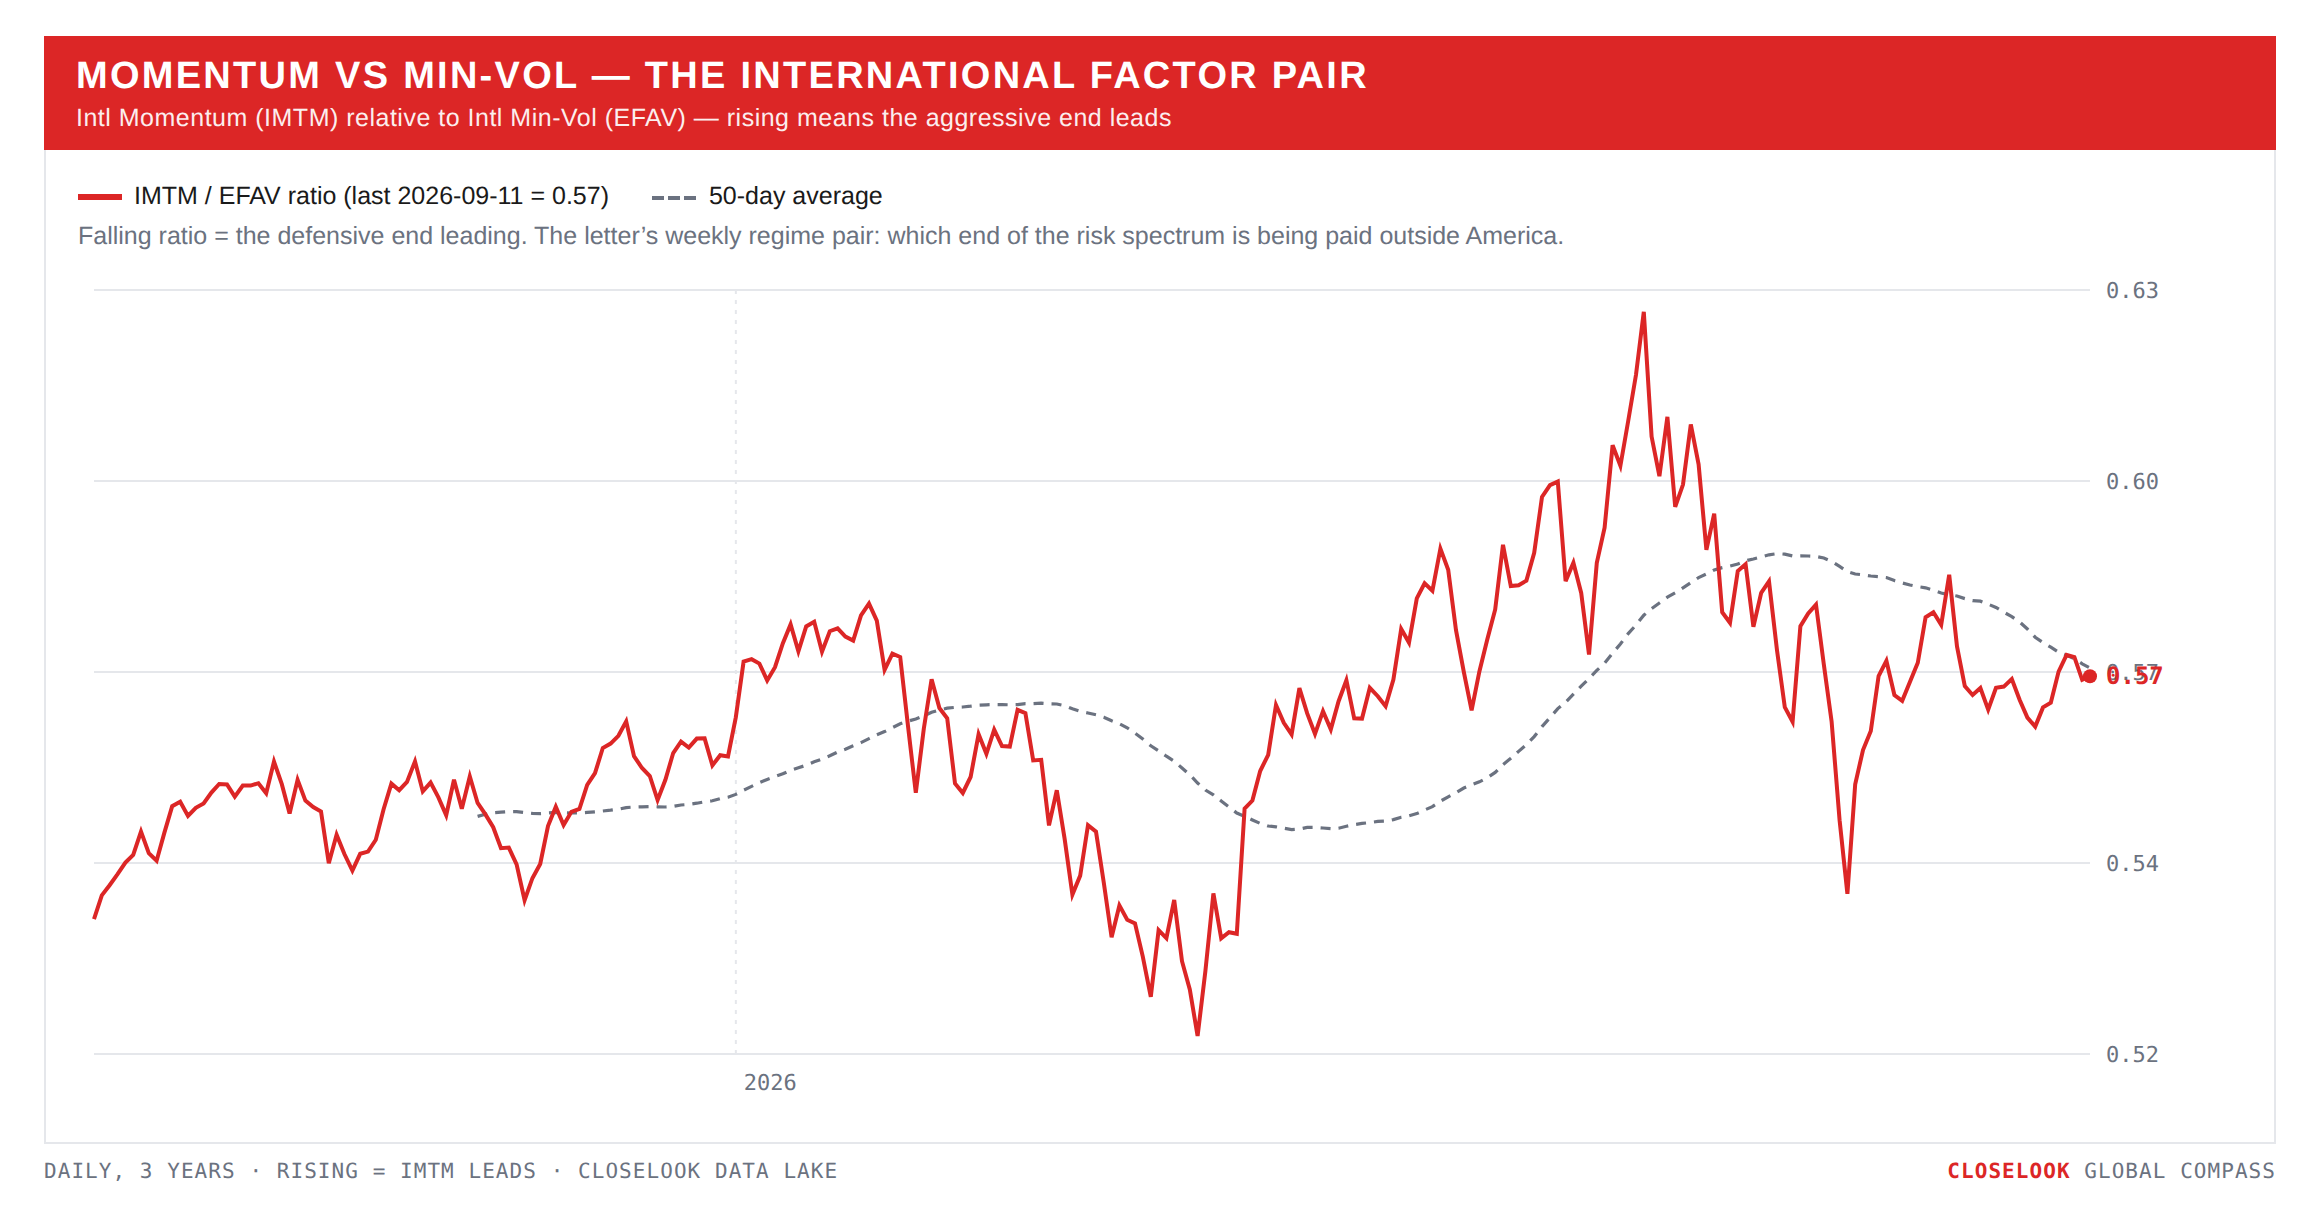
Momentum vs defensive — both ends fell, and the pattern broke the right way. International min-vol fell 0.84% to 93.98 — after three consecutive weeks of making a high and not holding it, it made no high at all. International momentum fell 0.96% to 53.74, ninety cents under the failed August breakout at 54.64, a fifth week below it. Global min-vol −1.75%. The defensive end fell almost as much as the aggressive end, on a week the world index fell 1.4%: the factor pair did not sort the week, the liquidation did. On the year momentum still leads min-vol +12.0% against +9.0%; the regime is intact, and for the first time in four weeks the week went neither with it nor against it — it went through it.
One more pair, awake and pointing the old way. EAFE value −0.81% against EAFE growth −2.23% — value led by 1.4 points on a down week, the second week running, and it led on the week the corridor's growth wrappers gave ground and the commodity exporters (Brazil, Norway, Poland) held. On the year value keeps the argument, +15.3% against +6.9%, and the gap widened to 8.4 points from 6.9. Last week both factor pairs moved the same way — momentum up, value up, min-vol up but fading — and this letter called it a repricing. This week momentum and min-vol fell together and value led growth: the risk appetite that changed neighborhoods last week went home this week, and the neighborhood it left was growth.
The Closelook letters — where this one sits. The house thesis, compressed: the stock market is a growing system at the aggregate level in which most constituents slowly fade while a small group massively outperforms — and that group changes dynamically; it never stays static. Own the aggregate, know the current winner group, watch for the rotation. Right now the winner group is the AI stack, and the live question is which of its layers — building, operating, using — earns the next leg. Three letters read that question at three altitudes: Closelook@Global Stock Markets (Saturdays) follows the geography of the money — regions, cross-asset, the core thesis owned through ETFs. Closelook@US Stock Markets (Sundays) reads the tape — the four-layer AI thesis at sector and index degree, the levels, the print records. Closelook@Hypergrowth (Sundays) reads the names — four growth buckets, the flow ledger, the tactical sleeve. Same market, top down. This is the map altitude.