Closelook@US Stock Markets
Sold for Four Days, Bought on the Number — The Sideways Market Is Running Out of Sideways
The S&P fell four sessions in a row into a hot inflation print and then rose one percent on the print itself. Underneath, the week sorted harder than the index did — the chip complex beat the market a second week while software gave back its year again, the Nasdaq 100 without its technology stocks turned negative on 2026, and the bond market broke both lines this letter had set. The Fed decides on Wednesday with a hike four-fifths priced, and October is the month that historically ends a late-summer consolidation one way or the other.
Current edition · 2026-09-13
1 · This Week's Action
The tape, day by day. A four-session week, and the index sold on three of them before it bought the one number it was supposed to fear. Monday was Labor Day; while New York was closed, Seoul rose 4.2% on the release of GPT-6 and Tokyo sold its software names. Tuesday −0.55%: the reopening session, only six Dow stocks up, Amgen −10% and Stryker −9% on the health-care side, Salesforce −4% on the software side, while the pipe names ran — Lumentum +11%, Corning +7.6% on 80 million miles of Verizon fibre, Coherent +7.1%, Intel +9.1% on a CPU price rise. The 10-year closed at 4.81%, its highest since 2023, and the September hike moved to 60% odds. Wednesday −0.46%: Brent through 100 for the first time since July after the tanker exchange in the Gulf, Europe −2%, and a midday flip in which the chips faded and the software names bounced — Cloudflare +10.5%, Datadog +7.2% — without lifting their fund: IGV still −0.8% at the close. The Treasury tripled its buyback to $6 billion. Thursday −0.60%, the fourth down day: the ECB hiked to 2.50%, US producer prices ran +5.4% on the year, the fastest since May, Brent settled at 107.63 after Houthi strikes cut Saudi capacity, the 30-year auctioned weak and closed at 5.36%, its highest since 2007, and the semiconductor index re-coupled on the way down, −2.74% — Intel −5.6%, Lam −5.6%, Micron −4.9%, Western Digital −4.4%, Nvidia −2.4%. Friday +0.85%: CPI came in hot by a tenth on the core, gasoline supplied a third of the headline, and hike odds for Wednesday went to roughly 82% — and the market had its first up day in five. Chips were bought back in the order they had been sold (Marvell +4.7%, Intel +2.9%, Arm +2.6%, AMD +2.1%); the memory and storage names were not (SanDisk −3.4%, Western Digital −2.4%, Micron −0.1%). The VIX fell 11%.
Four sessions, and the S&P finished −0.77% at 764.29, the Nasdaq 100 −0.57% at 714.88 — under its 50-day (710.41) at Thursday's close, back above it by 0.6% on Friday — and the equal-weight S&P −1.89%, the third consecutive week cap-weight beat equal-weight, and by the widest margin of the three. The Russell 2000 −2.41%. Everything that happened this week happened underneath the index again, and this time the index itself moved: from 1.0% under its August 13 record close to 1.75% under it, on a week in which the everything-else market lost two to three percent.
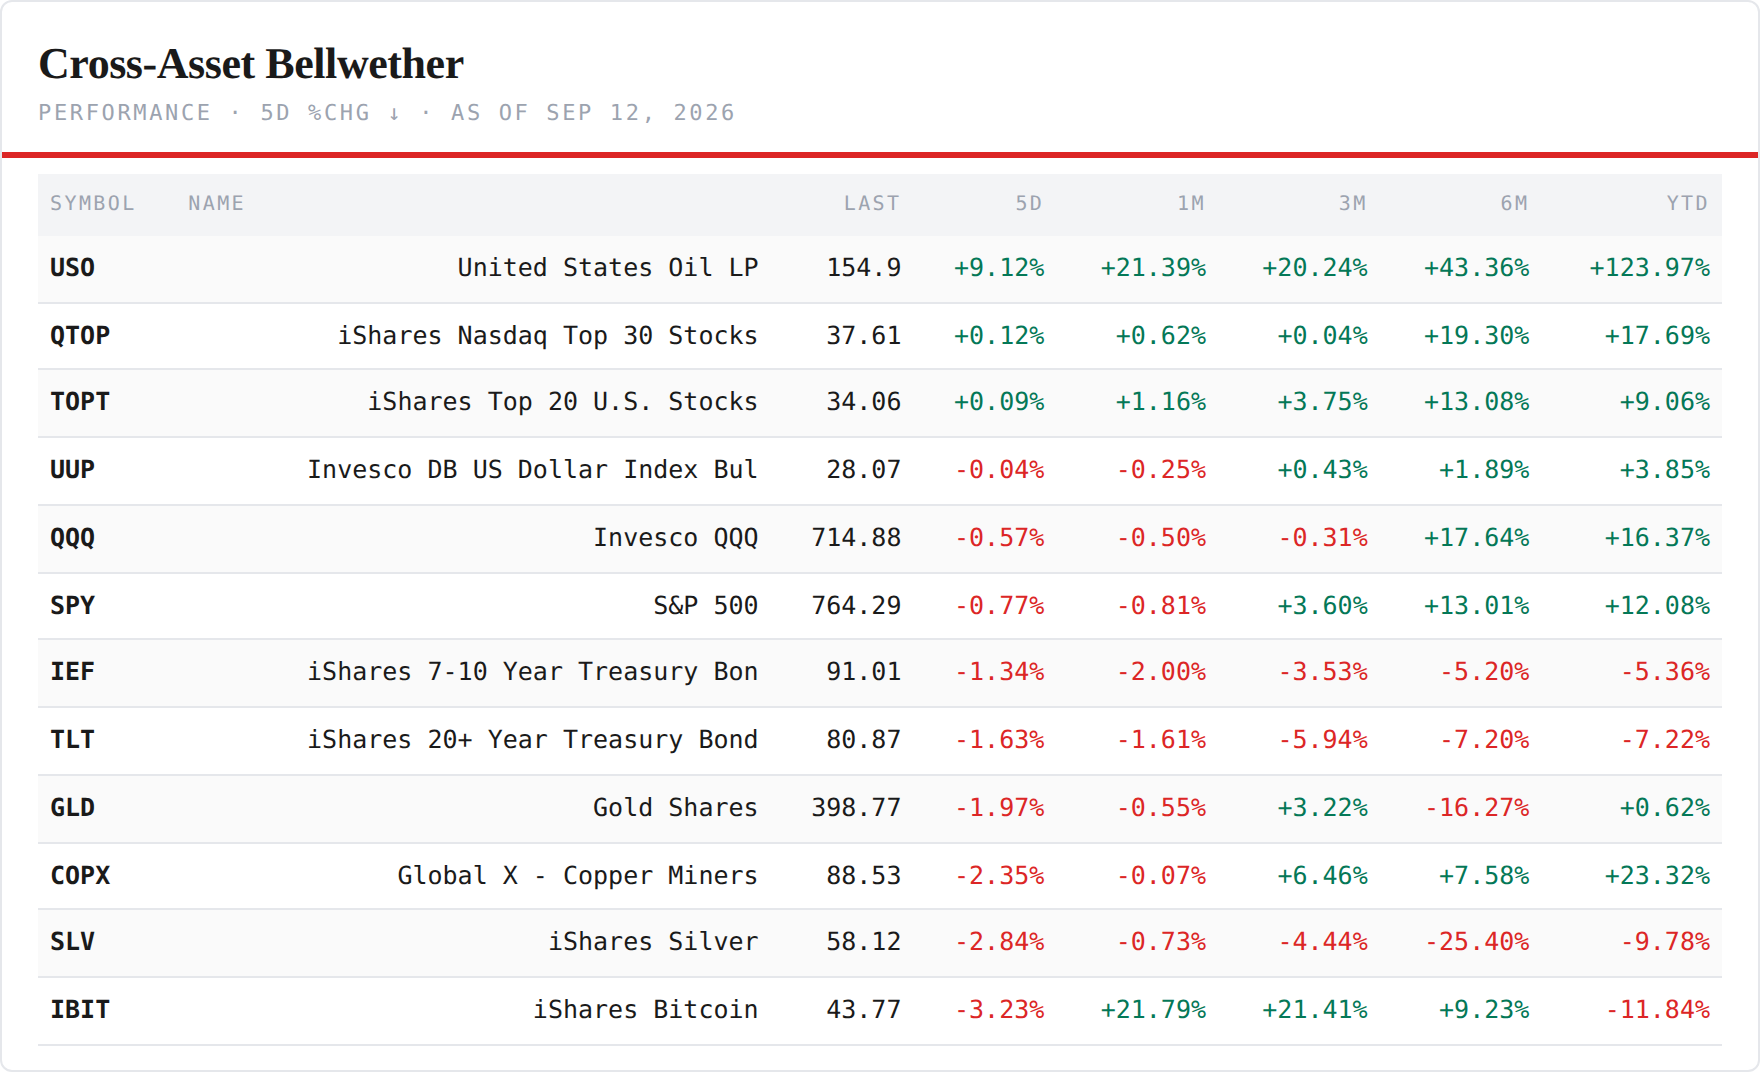
The cross-asset board — oil owns it a second week, and nothing else is green. USO +9.12% on the week, a second consecutive nine-percent week, +21.4% on the month, +124% on the year — Brent 96.28 to 104.61 with a 107.63 close on Thursday, WTI settling above 100 on Friday. Then two top-heavy US cuts at +0.12% and +0.09%, the dollar flat, and everything else red: the Nasdaq 100 −0.57%, the S&P −0.77%, IEF −1.34% to 91.01, TLT −1.63% to 80.87, gold −1.97% to 398.77, copper miners −2.35%, silver −2.84%, the coin fund −3.23% to 43.77. Both Treasury funds made new closing lows for the year — TLT's on Thursday at 80.78 — and both hedges lost the lines Saturday's letter had set: gold closed under its 396.75 falsifier on Thursday and back above on the weekly, bitcoin's fund lost both 44.5 and 44, and the coin itself left its 77,000–83,000 zone by the floor. Saturday's letter carries the sovereign board and the hard-asset charts in full; the one-sentence version for the tape: the bond market broke its lines before the equity market broke any of its own, and the hedges did not hedge. On the charts, gold and bitcoin consolidated rather than broke — gold gave back two percent inside a range it has held for a month, the coin fund three inside a month it is still up 22% on — and the read stays open: either a dead-cat bounce inside a top, or a consolidation preparing the next leg up. Both hedges will answer that on the far side of Wednesday, with the same catalyst the equity range is waiting for.
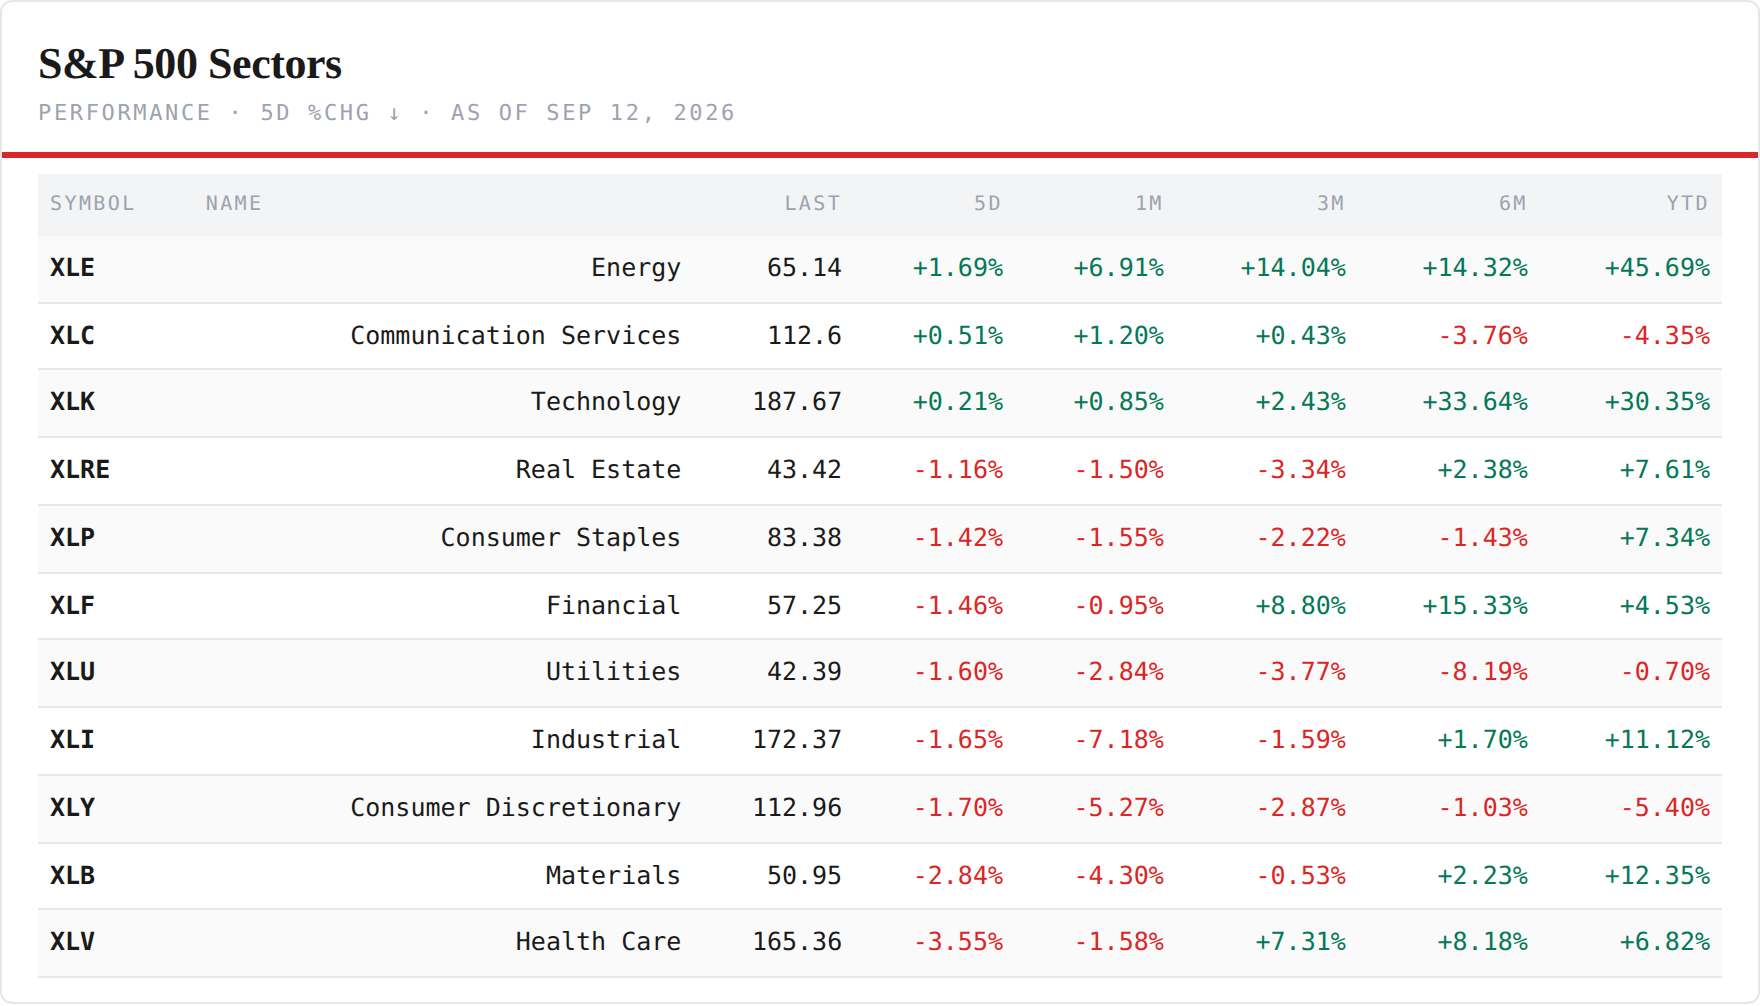
The sector read — three green of eleven, and the leader is the one the oil price names. Energy +1.69%, communications +0.51%, technology +0.21% — the only green. Eight red: real estate −1.16%, staples −1.42%, financials −1.46%, utilities −1.60%, industrials −1.65%, discretionary −1.70%, materials −2.84%, and health care −3.55%, the worst line, on Amgen −13.7% and Stryker −9.1% — the sector that held the quarter crown a week ago. Last week five sectors were green and the inversion pattern broke; this week the survivors of that break — energy and technology — held their green, and the rest of the board fell together. A tape that sold eight of eleven sectors and rose on Friday anyway is a tape whose index is being held up by its narrowest layer.
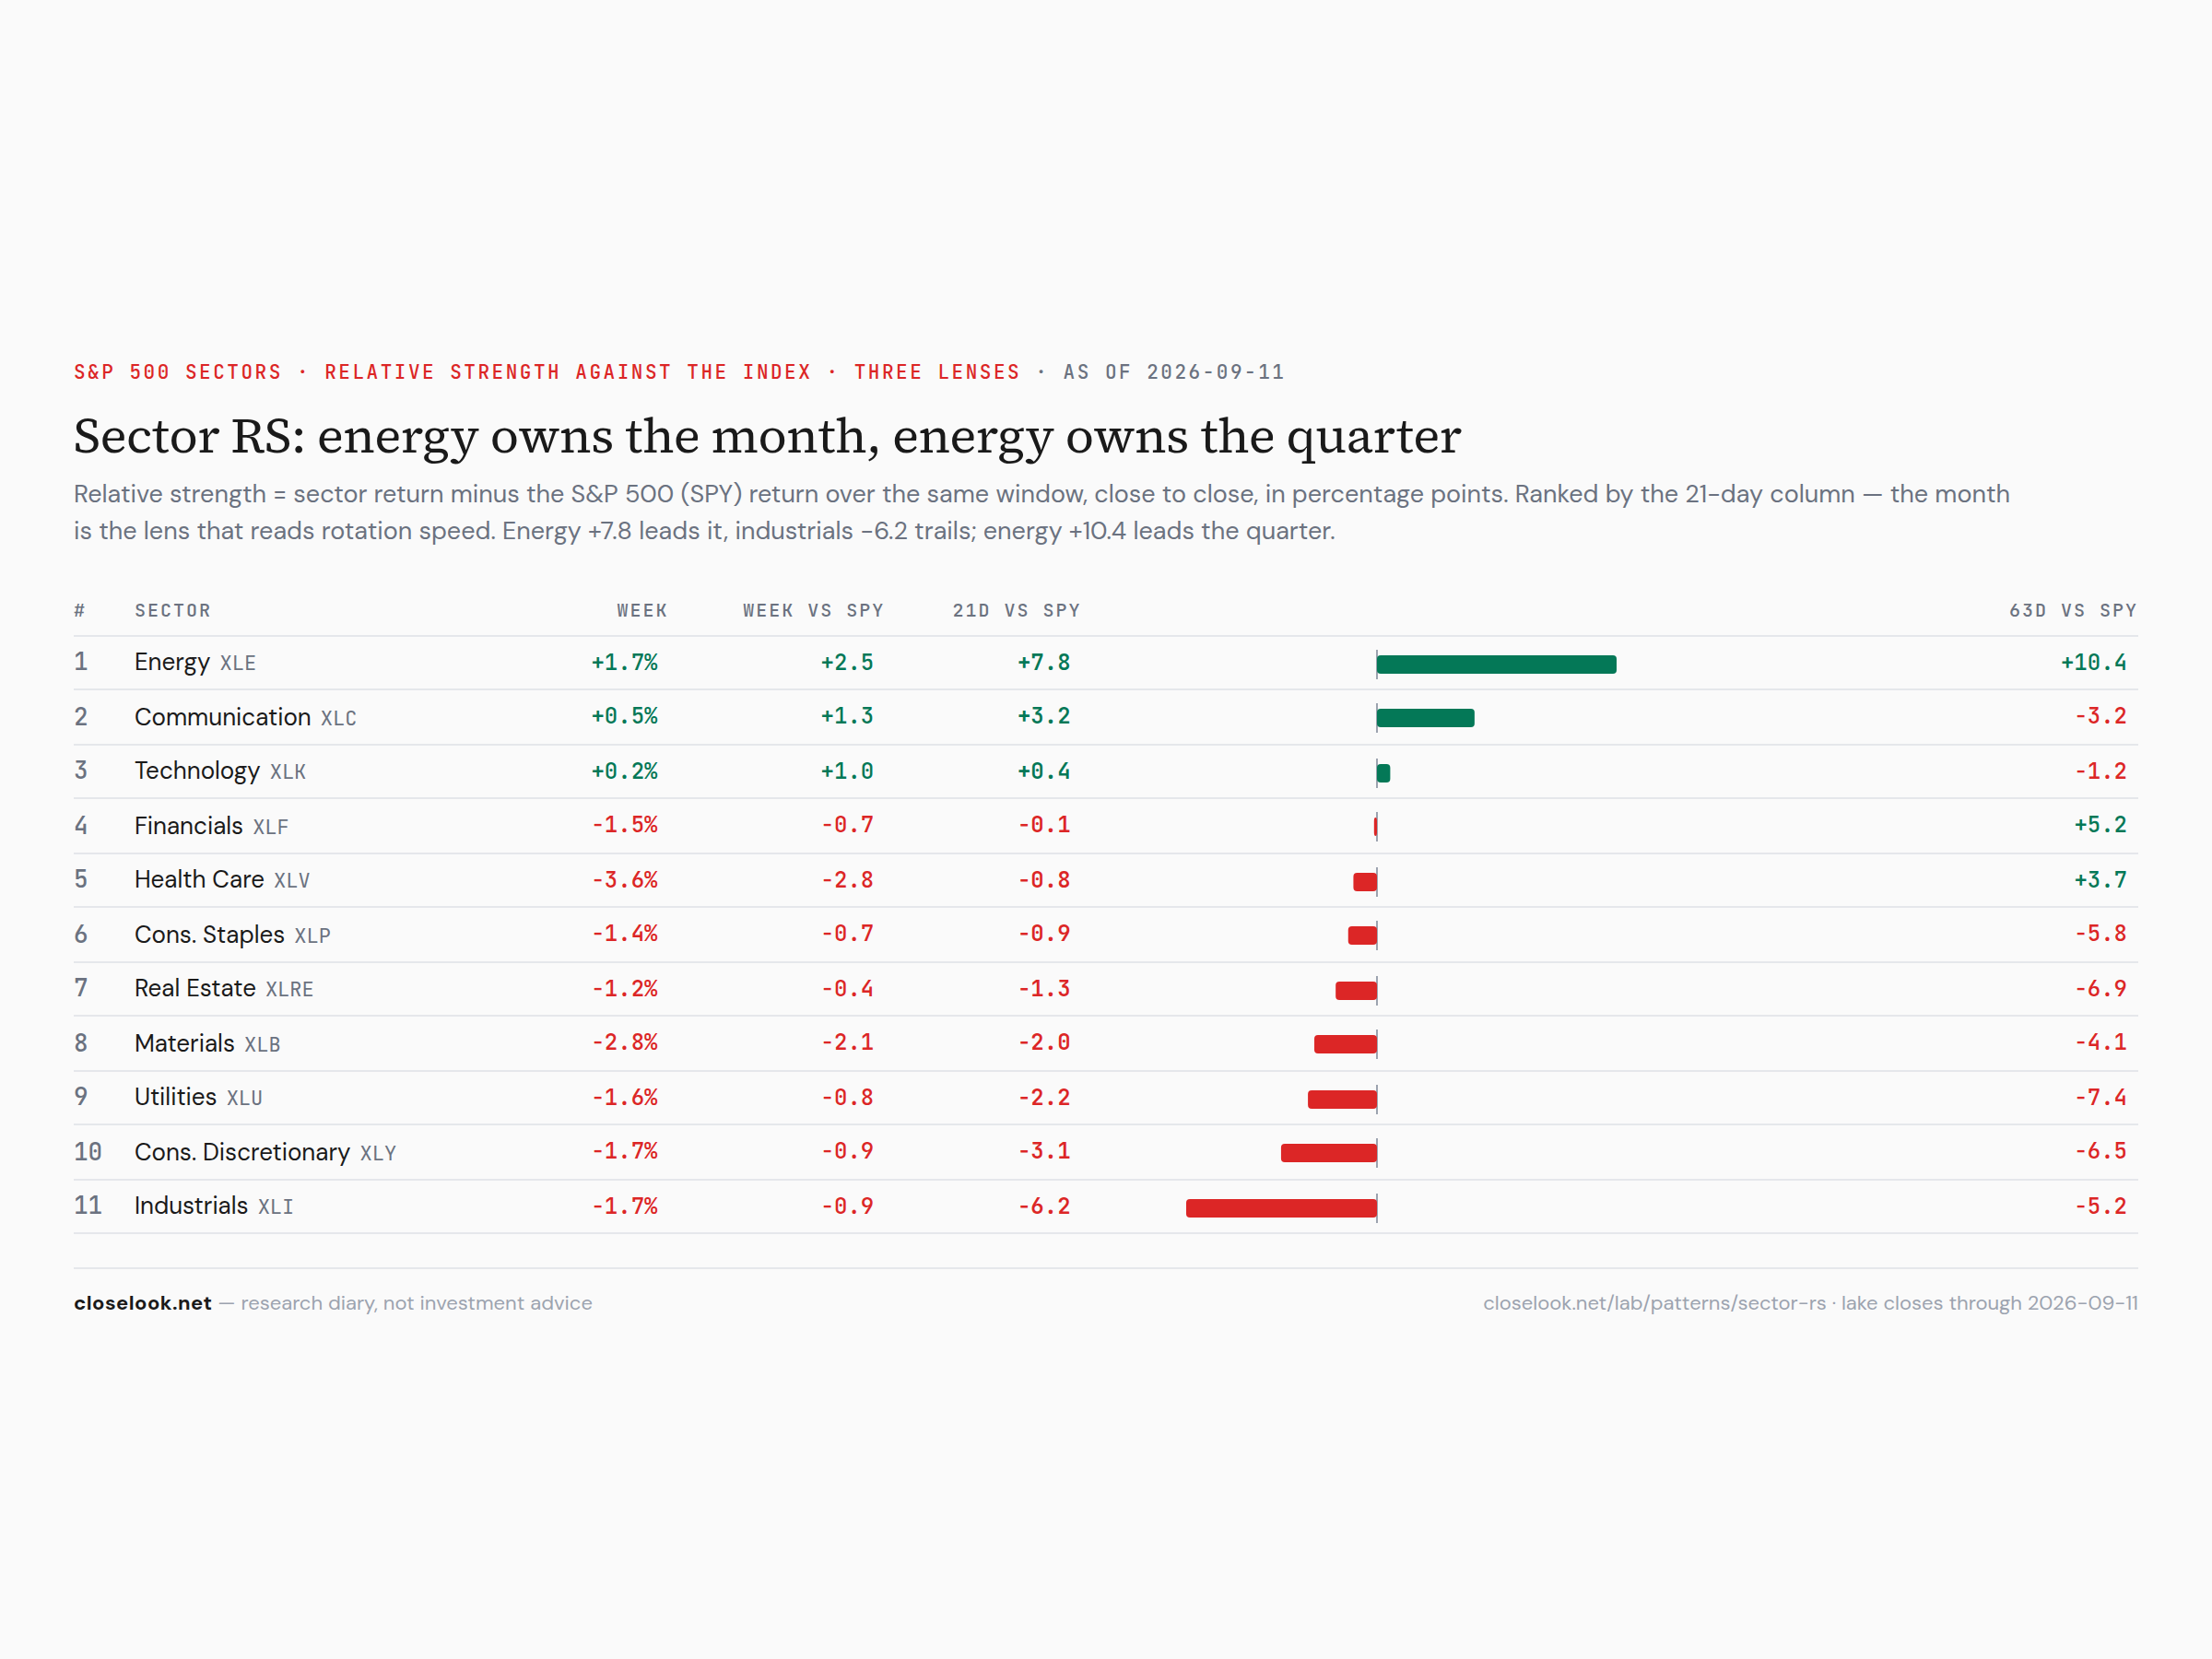
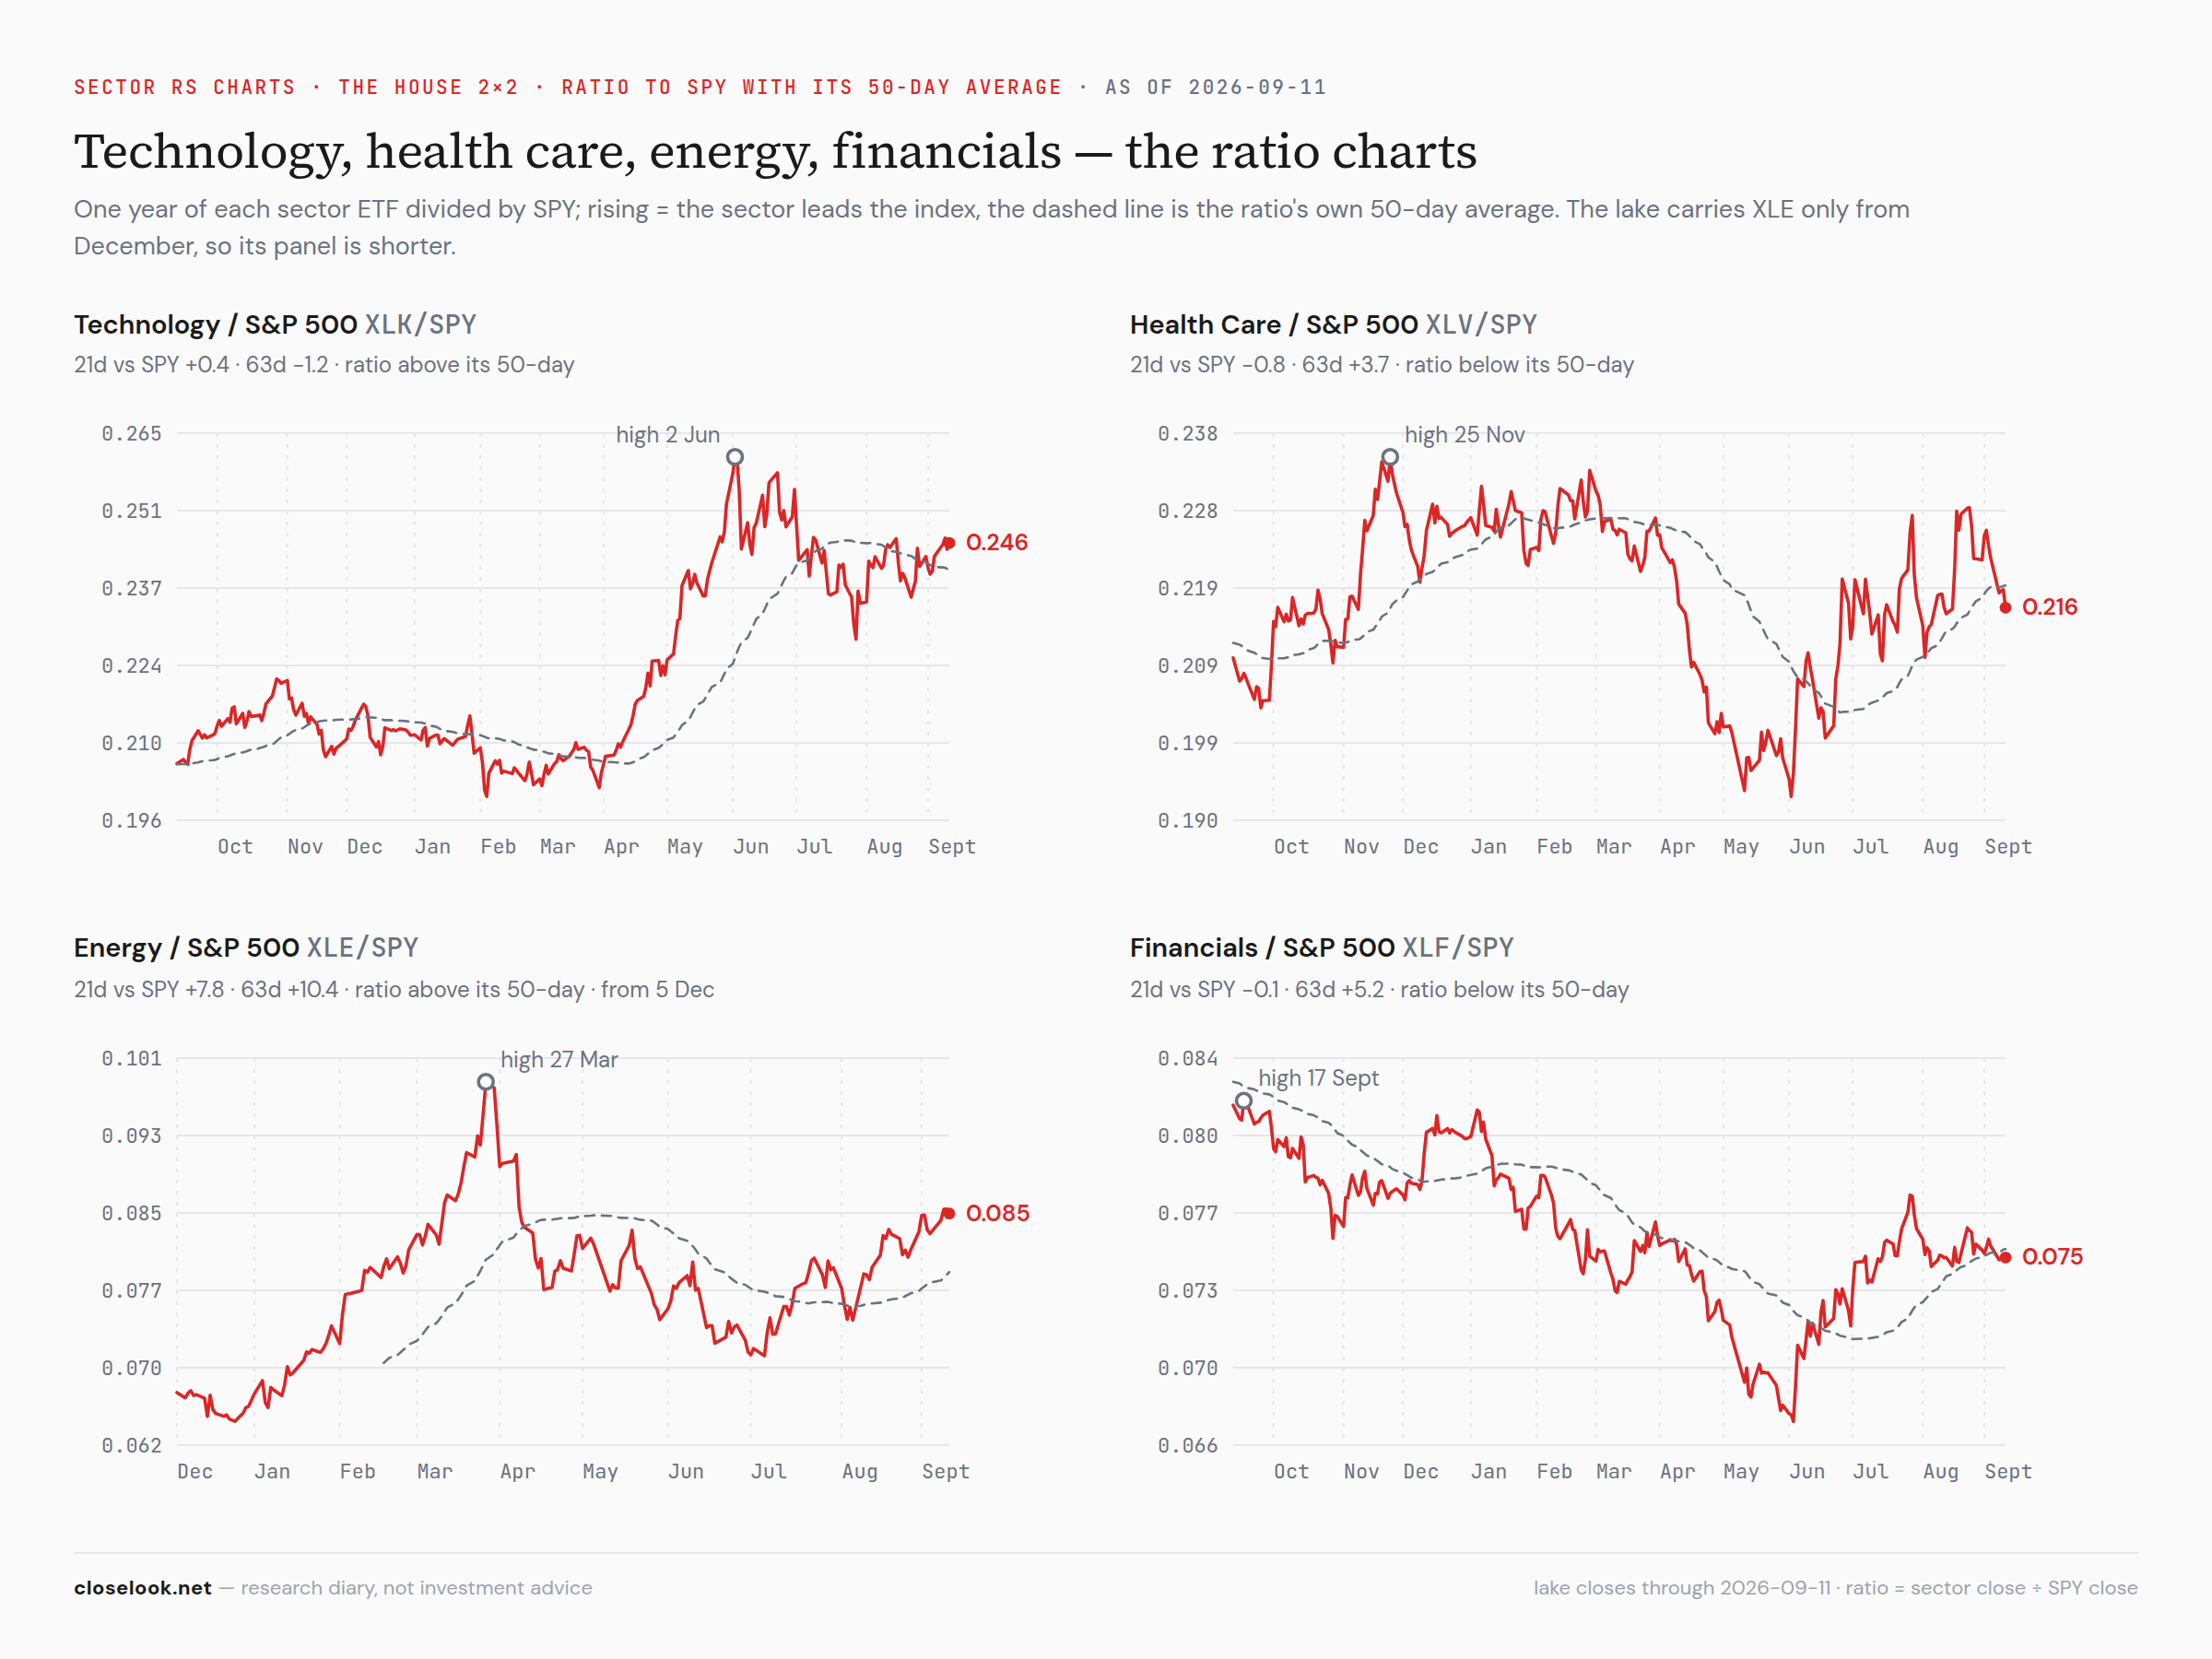
The sector rankings — relative strength, three lenses; energy took the quarter, health care lost its month. Our sector-RS board reads the rotation's speed, and this week it reads one leader on both lenses: energy +7.8 points against the index over 21 days, +10.4 over 63 — the month narrowed from +11.7 as the sector was sold on Thursday with oil up 5.9%, but the quarter is now energy's outright, from +6.7 a week ago. Health care: −0.8 on the month, +3.7 on the quarter — from +4.4 and +7.6 a week ago, the fastest deterioration on the board; the quarter crown it held for a month is gone. Technology: +0.4 on the month, −1.2 on the quarter — flat on every lens, the tired leader that is no longer a drag and not yet a leader. Financials −0.1 and +5.2: flat month, strong quarter, fading. Communications +3.2 on the month, the second-best 21-day line, on Meta. And the bottom did not move: industrials −6.2 over 21 days, the worst line again, utilities −2.2, discretionary −3.1 with its quarter at −6.5. Last week the rotation ran in one direction, toward the sector a Hormuz headline prices first. This week it ran the same way, and the sector it prices last — the consumer — kept falling.
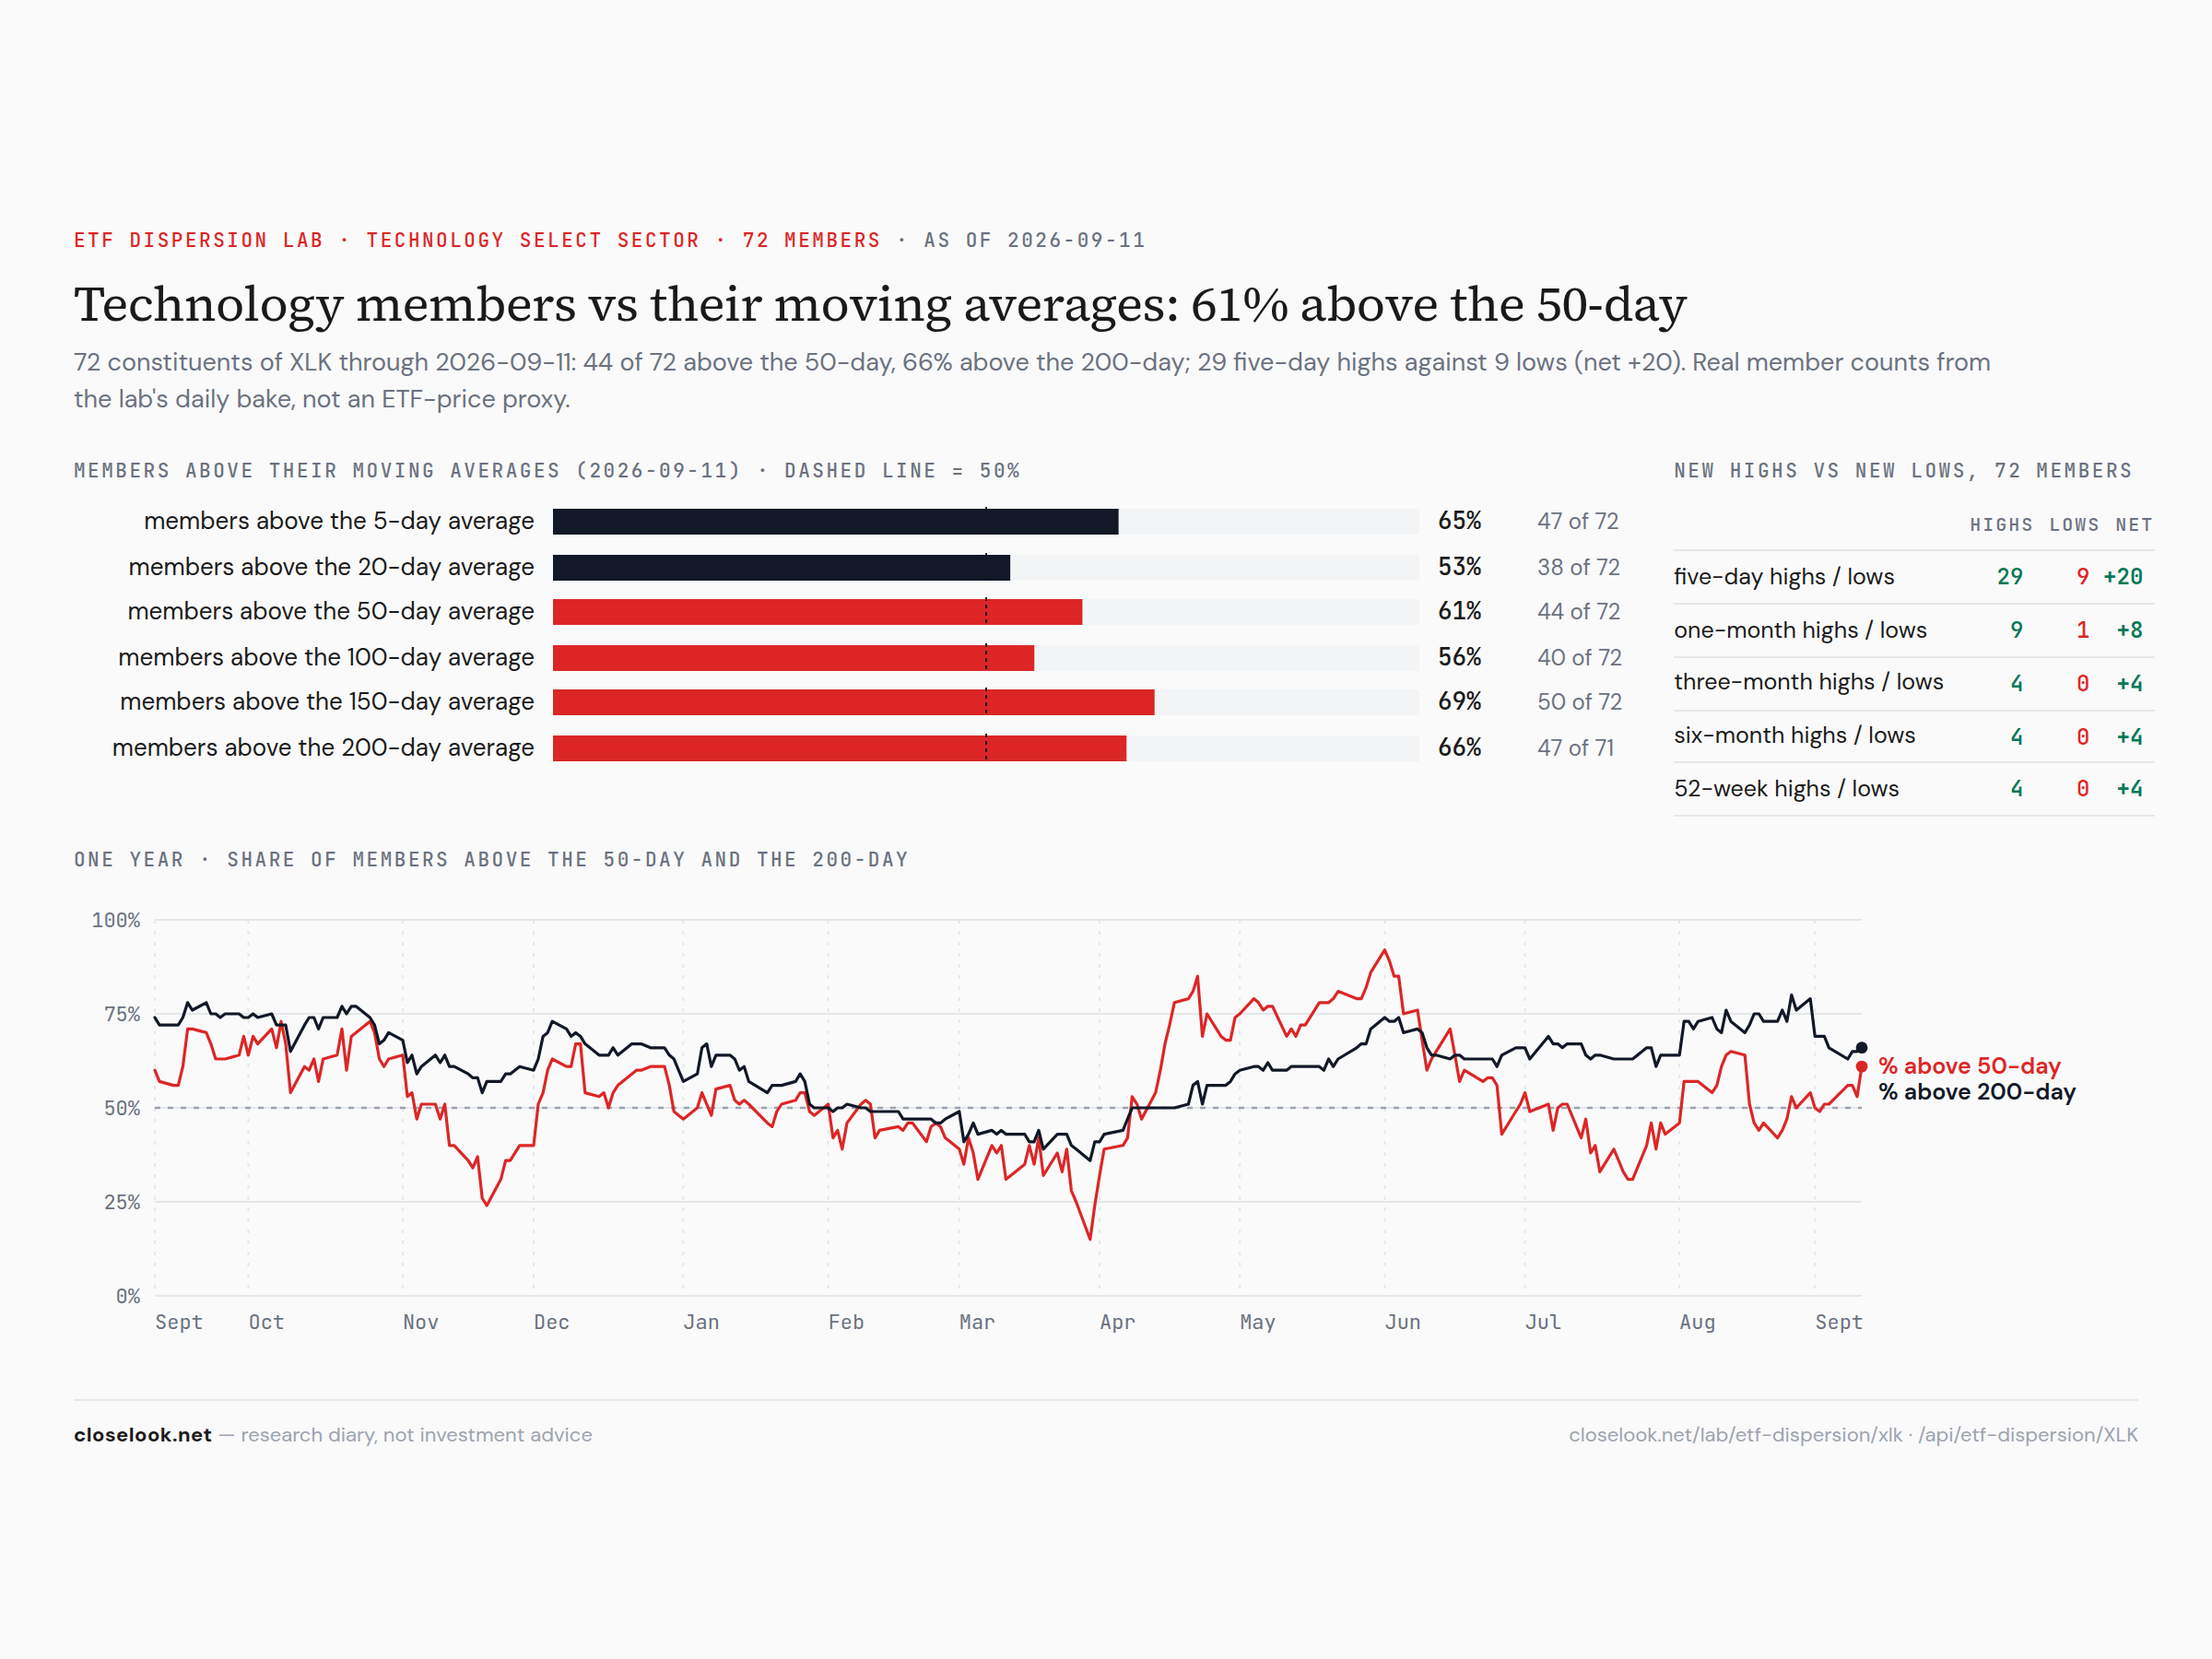
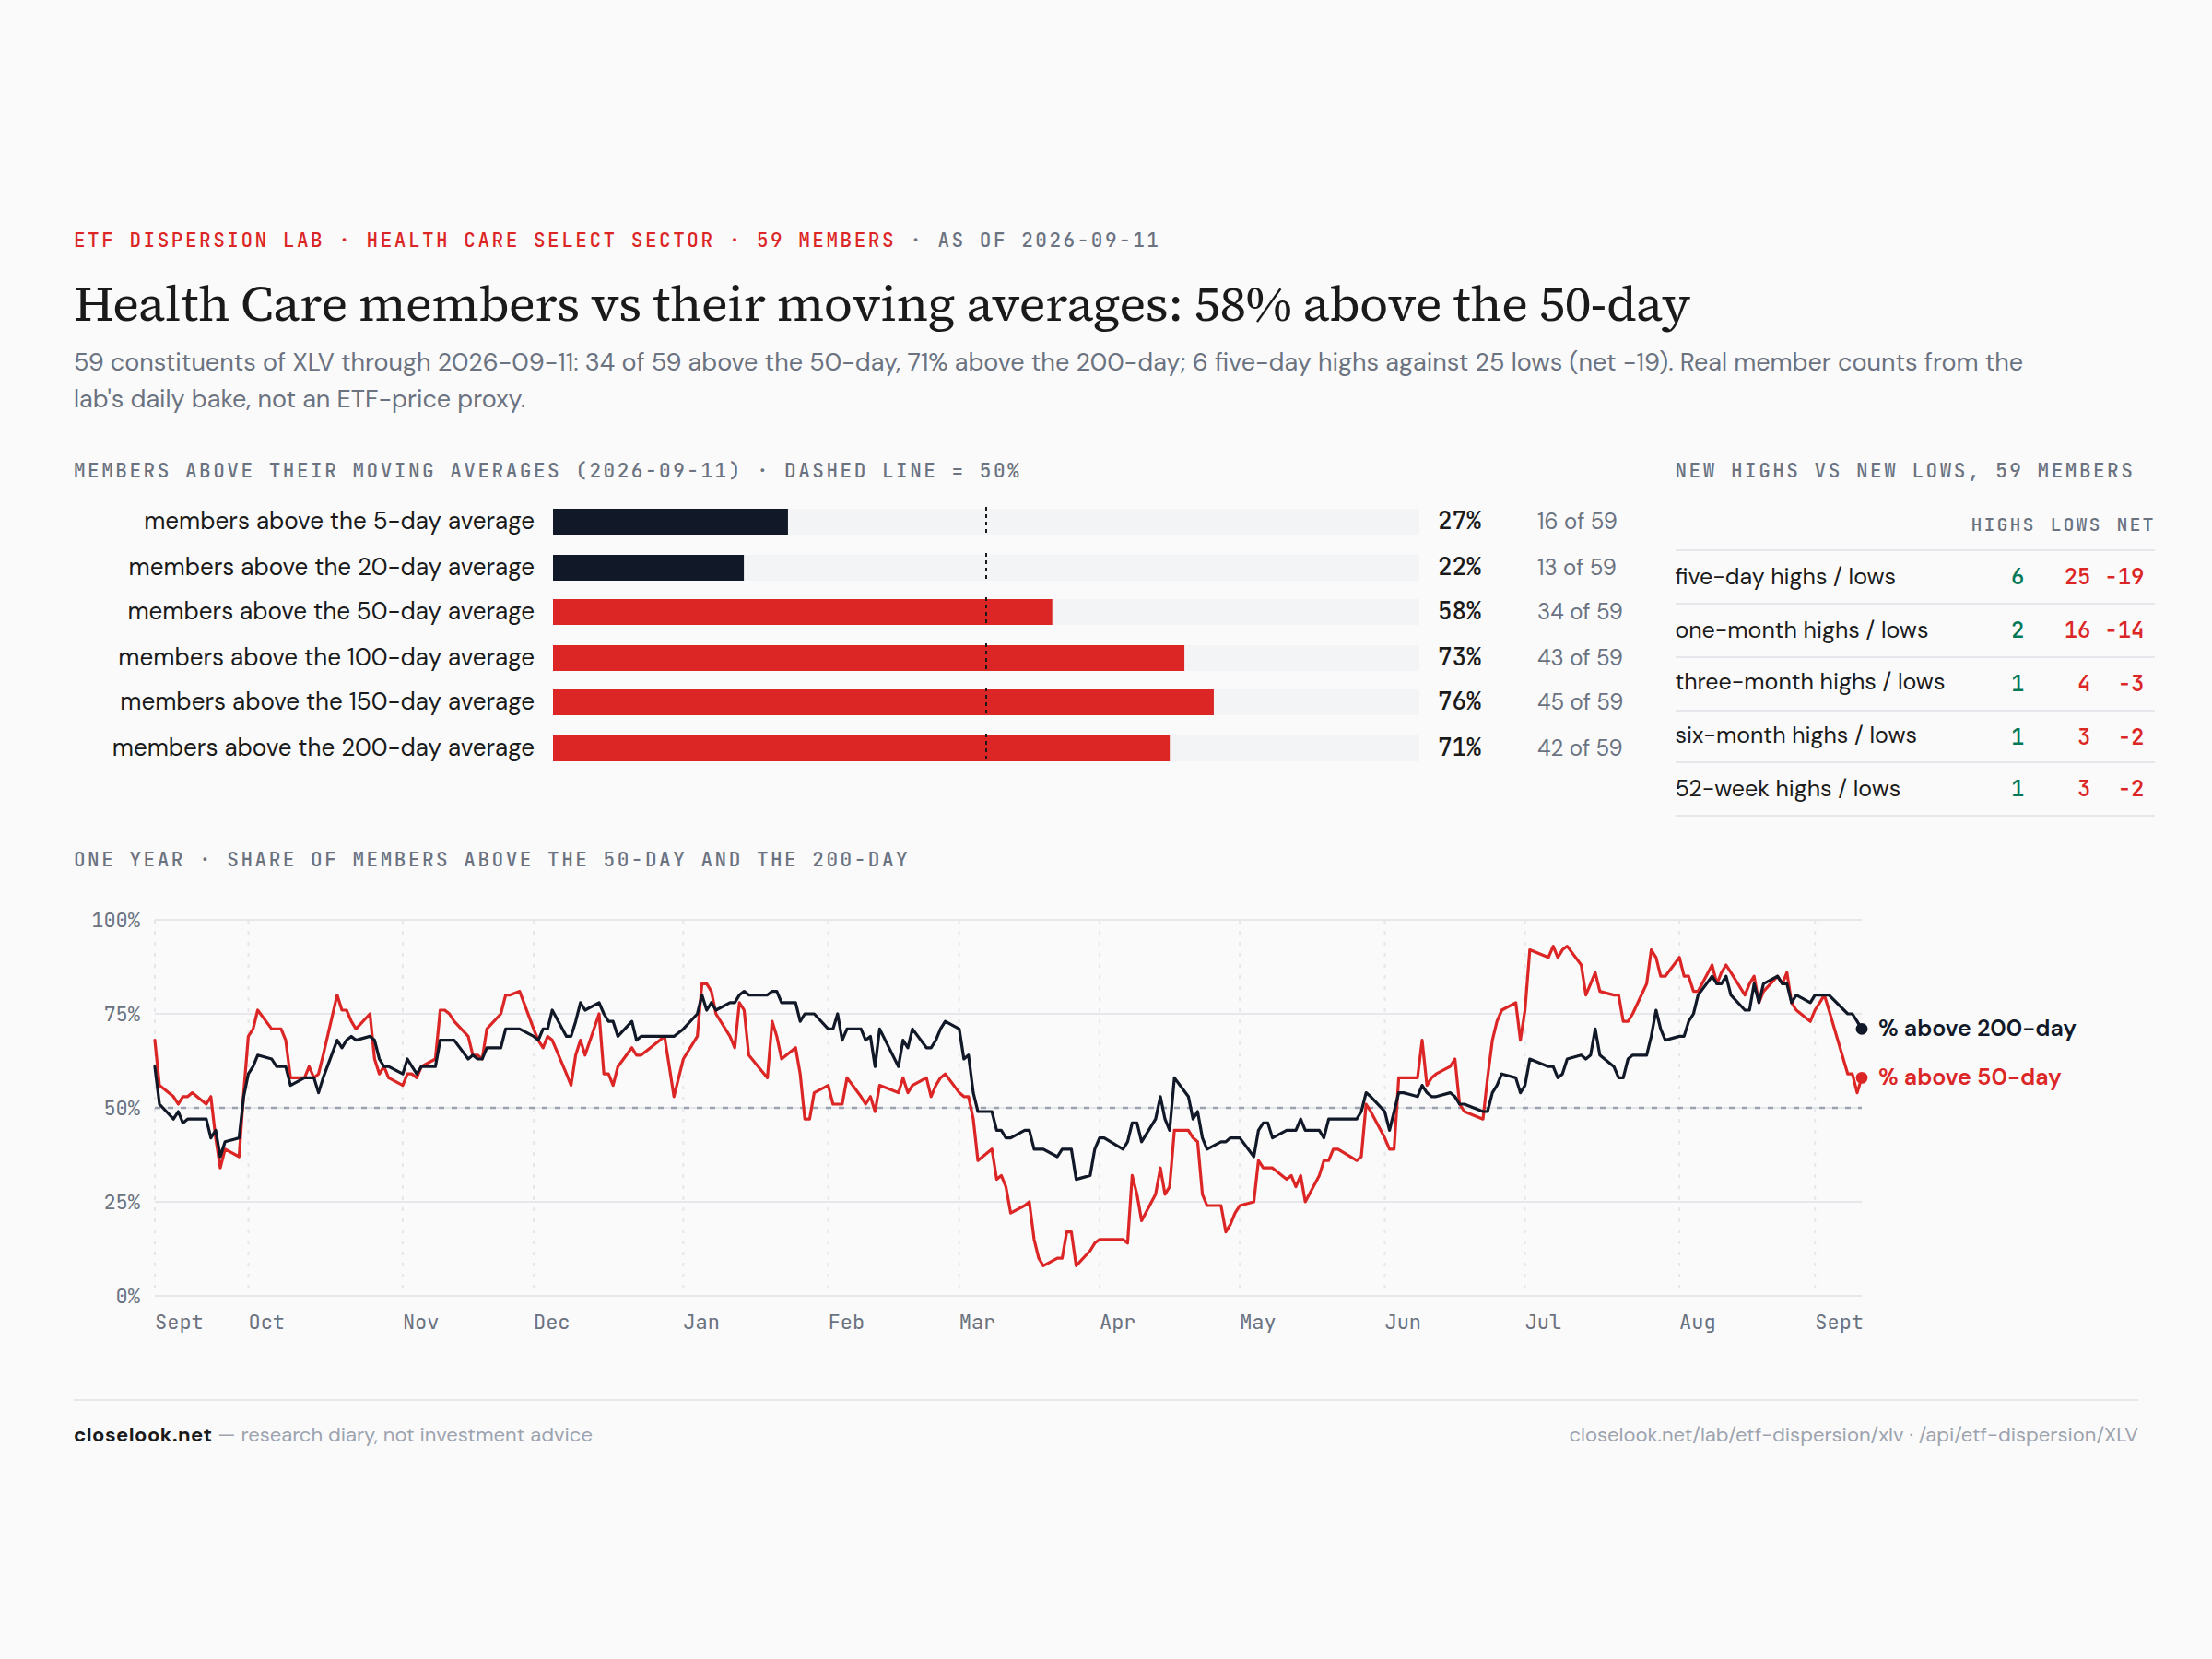
Underneath the four focus sectors — the internals firmed where the surface did, and broke where it broke. The dispersion pages show the members behind each ETF. Technology: 61% of members above their 50-day, from 51% a week ago, and 29 five-day highs against 9 lows — a +20 net after last week's +13, the strongest internal reading on the board, in a week the sector's ETF rose a fifth of a percent. The chip names printed the highs on Friday. Health care: 58% above the 50-day, from 76%; 22% above the 20-day; and 6 five-day highs against 25 lows, −19 net after −14 and −20 in the two prior weeks. The medium-term structure that held through two weeks of surface selling gave way this week: the 100-day count fell from 83% to 73%. Financials: 34% above the 50-day but 80% above the 100-day — the quarter's structure intact, the month's gone. Energy: 81% above the 50-day, 6 highs against 5 lows — the sector that led was sold on Thursday and bought on Friday, evenly. Industrials the broken one: 21% above the 50-day, 15% above the 20-day, 11 highs against 14 lows. Three weeks ago the internals rotated as fast as the surface; two weeks ago they sorted silicon over code; this week they sorted the same way, and added a second axis: anything with a duration or a consumer in it was sold underneath its ETF.
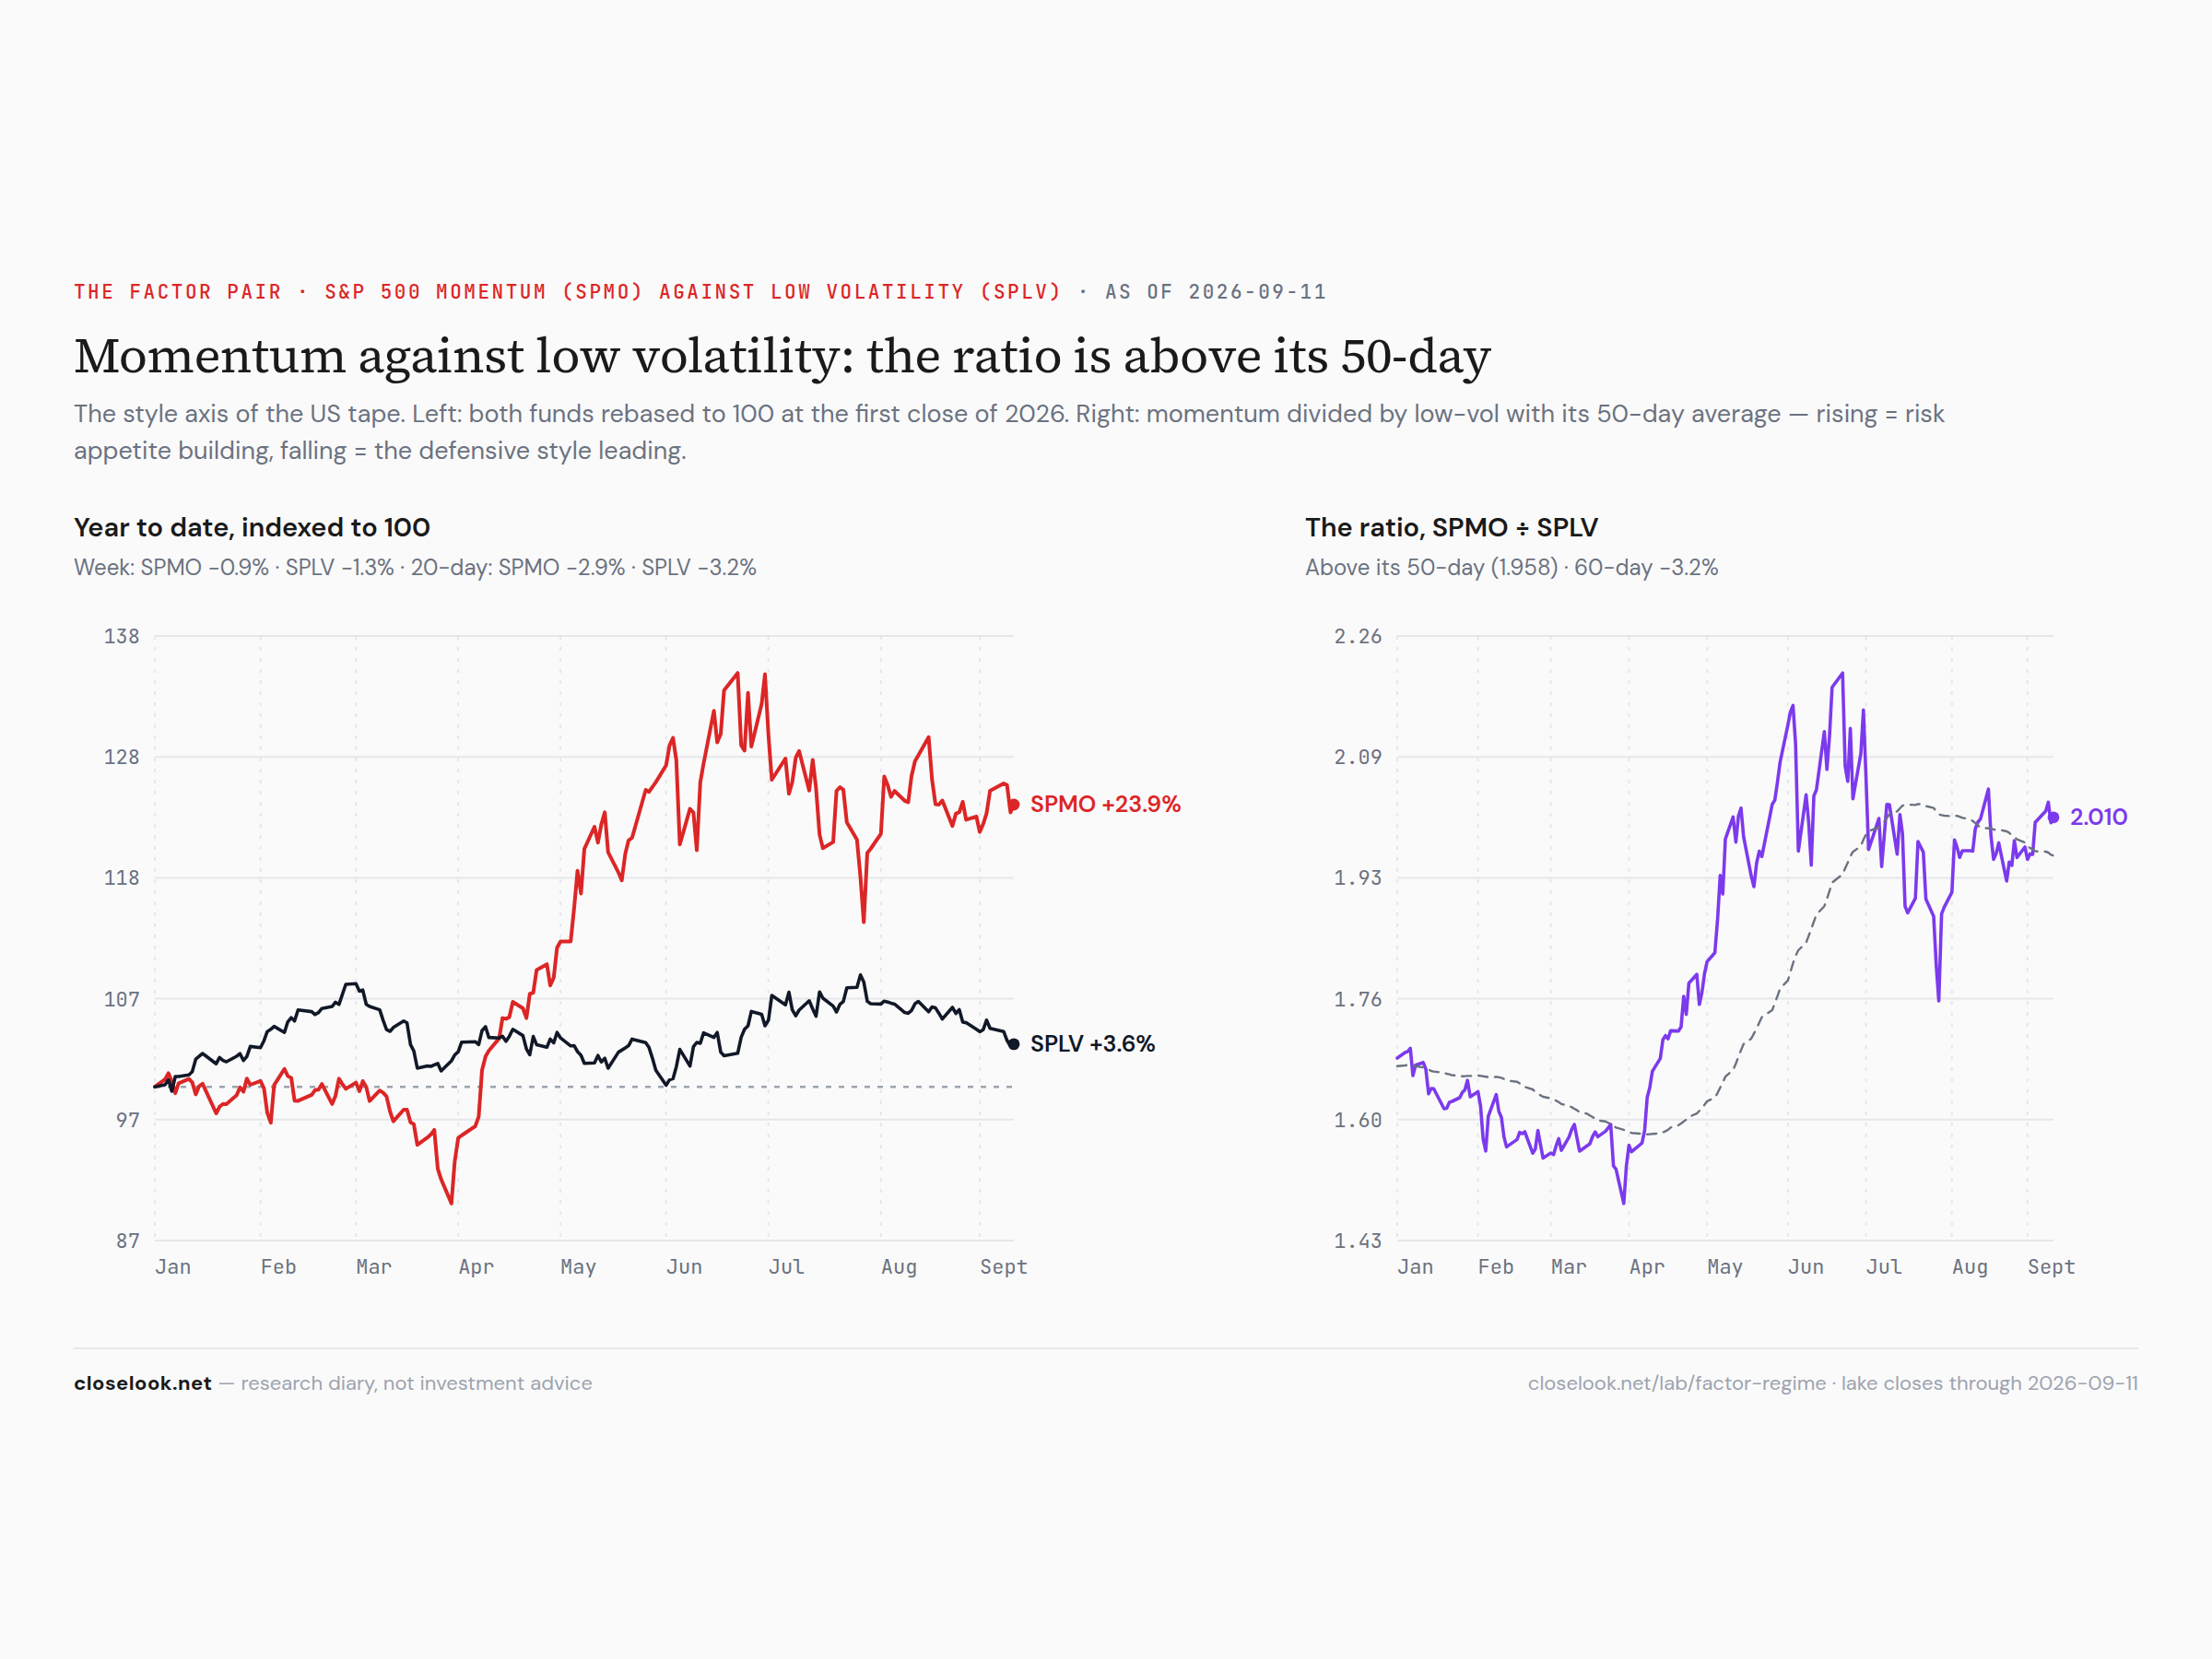
The factor read — the label held with both legs down. The factor-regime gauge kept last week's state — momentum-over-low-vol indexed at 159.61 against a 50-day at 155.45, above trend, at the 94.4th percentile, "momentum leading, risk appetite building" — on a week in which both legs fell: SPMO −0.94% against SPLV −1.27%. The spread widened because low-volatility fell more, not because momentum rose; the twenty-day rates of change are −2.89 on momentum and −3.2 on low-vol, the sixty-day spread −3.16. A gauge that reads "risk appetite building" while both of its inputs decline is reading the relative preference, and the relative preference is unchanged: when the tape sold this week it sold the defensive factor harder than the momentum factor. Saturday's letter found the same on the international pair. It is a reading of what the market did not do — it did not run to low-vol into a hike — and it is the reading a consolidation gives before it resolves, in either direction.
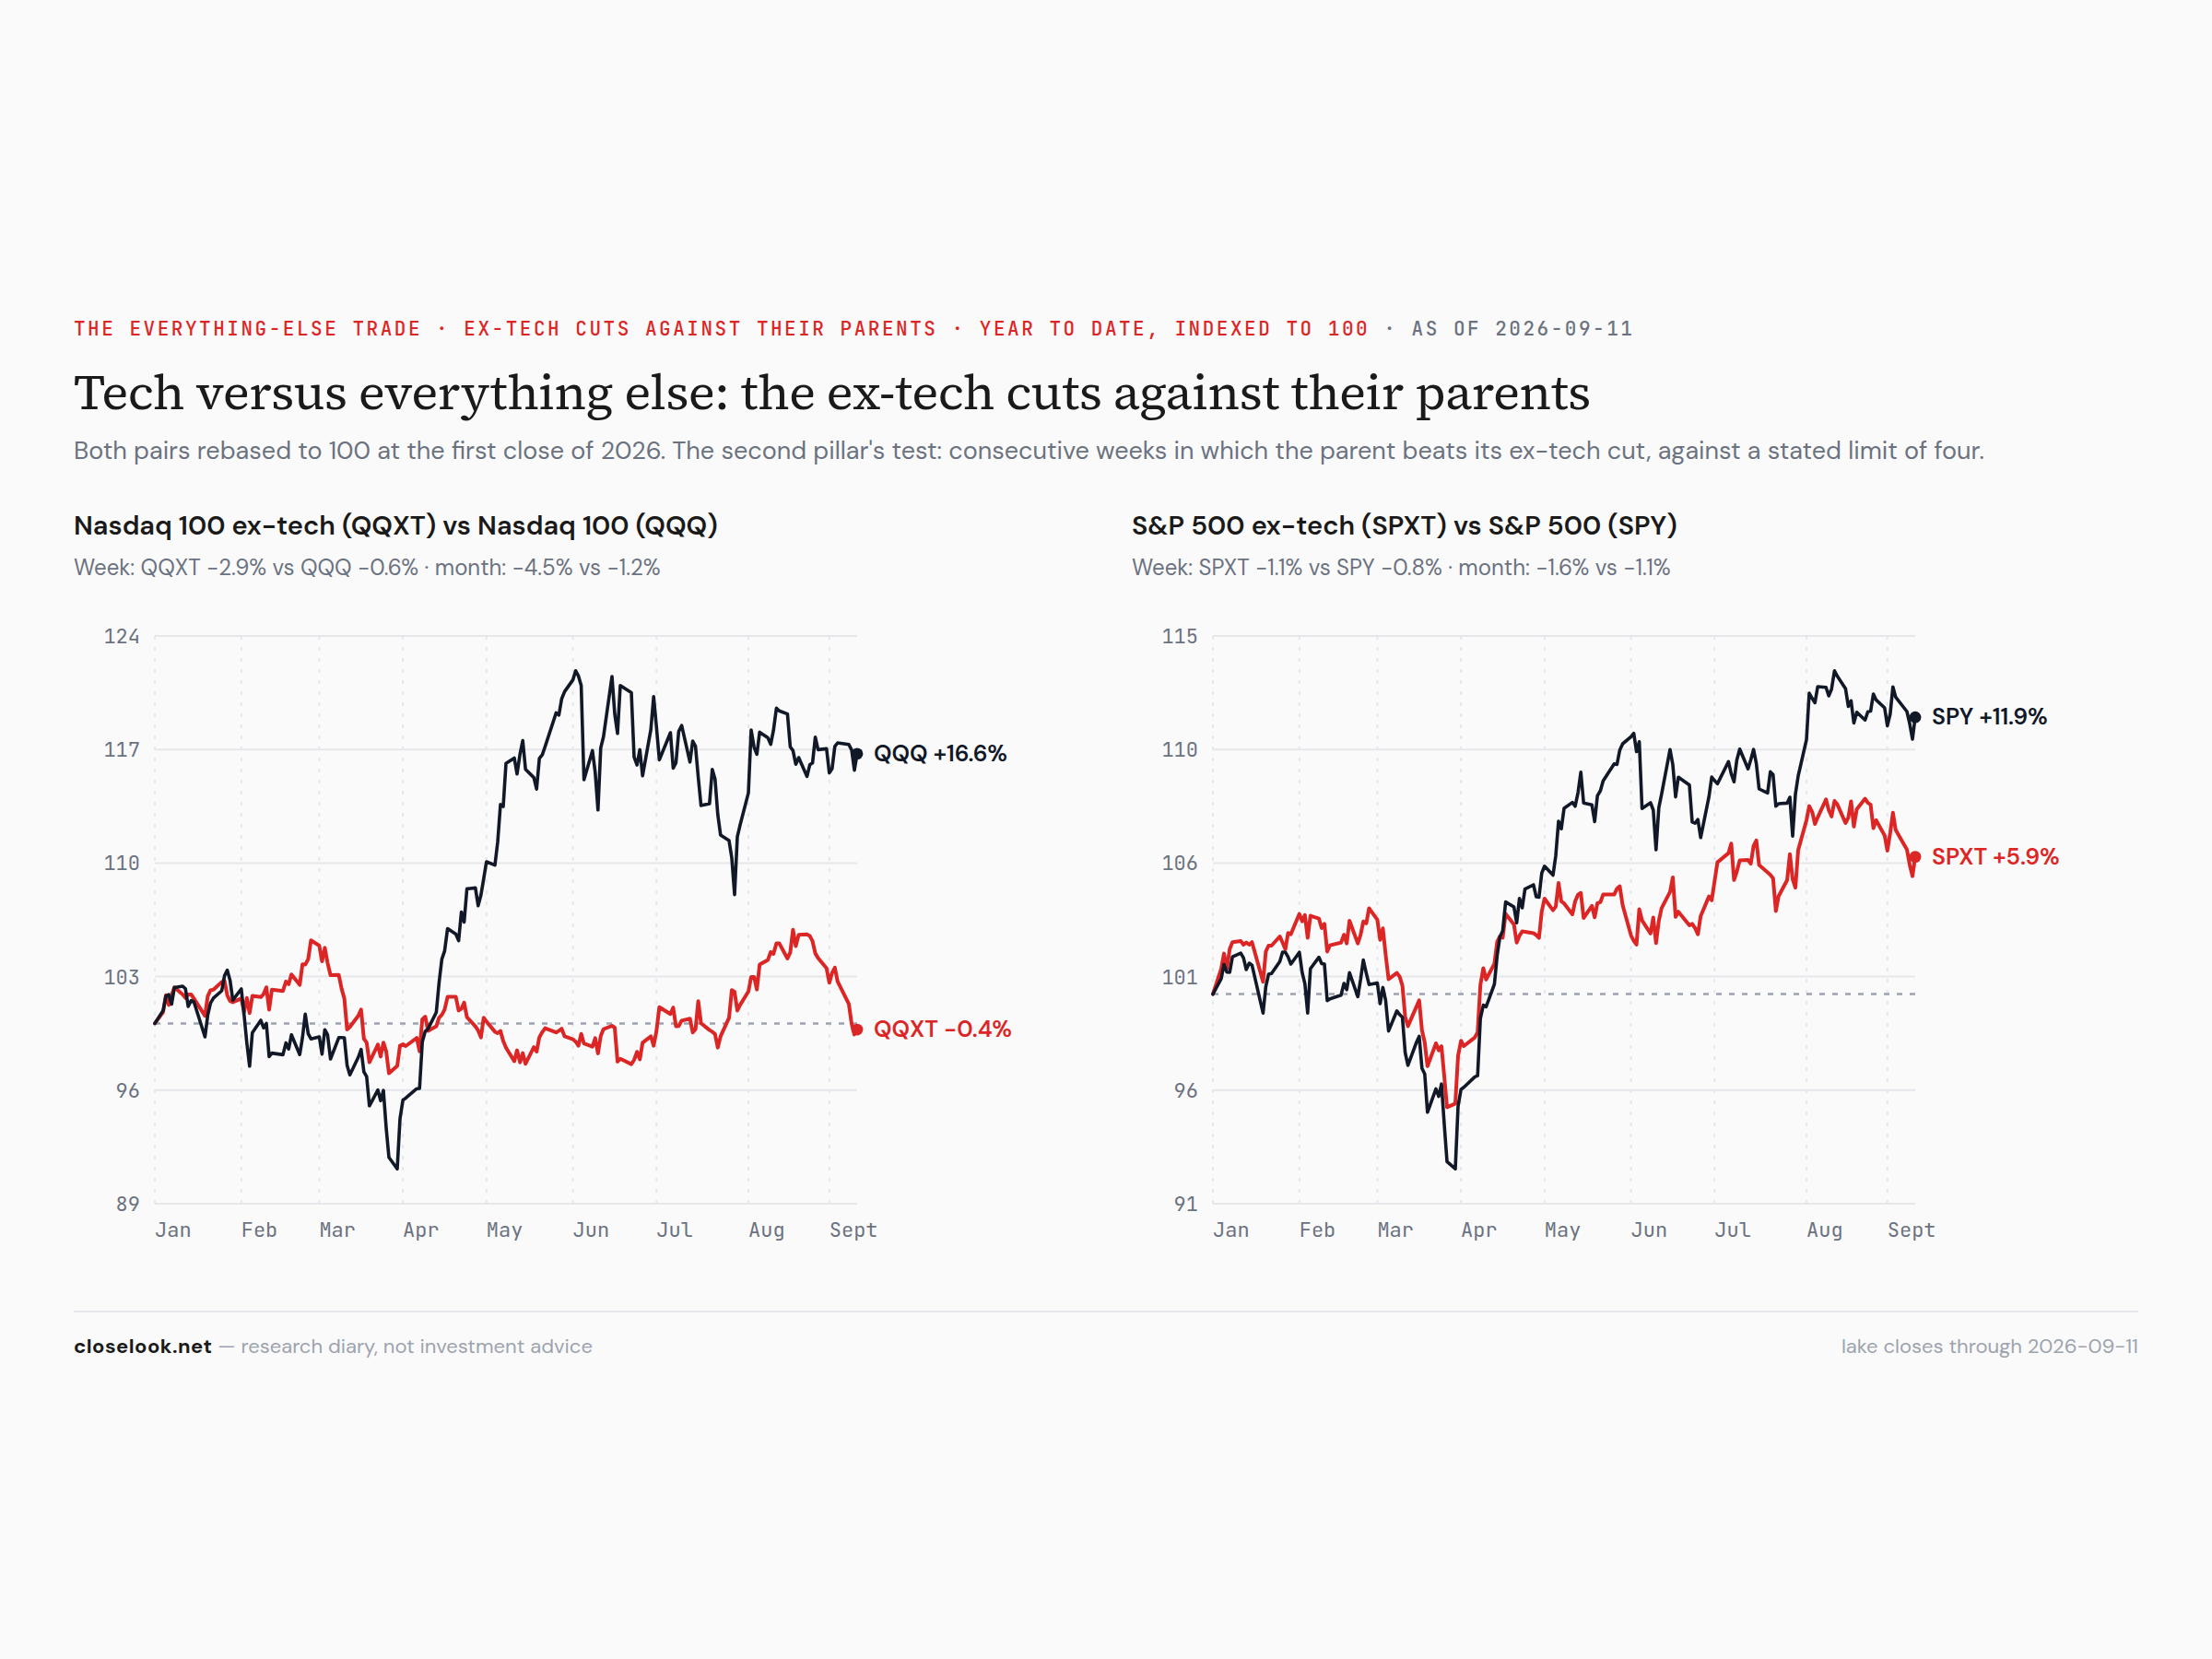
The axis, one week on — the everything-else trade fell to negative on the year, and that is the week's most important number. Three weeks ago the ex-tech cuts led at three-year highs. This week: the Nasdaq 100 ex-technology −2.89% against the Nasdaq 100's −0.57%; the S&P ex-tech −1.07% against the S&P's −0.77%; the S&P ex-Magnificent-7 −1.10%. The count of consecutive weeks tech beats its ex-tech cuts stands at three, against a stated limit of four. And the year-to-date order, which had read the other way since August, no longer does: the Nasdaq 100 without its technology stocks is at 98.60, −0.78% on 2026, against +16.37% for the Nasdaq 100 — about six percent under the three-year high it printed on August 19. Read that plainly: every point the Nasdaq 100 has made this year has come from its technology stocks, and the other half of the index — the Bookings, the Amgens, the consumer and health-care and industrial names — is now down on the year. The equal-weight technology sleeve fell 1.19% while the cap-weighted index fell 0.57%; the equal-weight Nasdaq 100 fell 2.08%. This is the profound weakness underneath the index: not a rotation out of technology, but the absence of anything else.
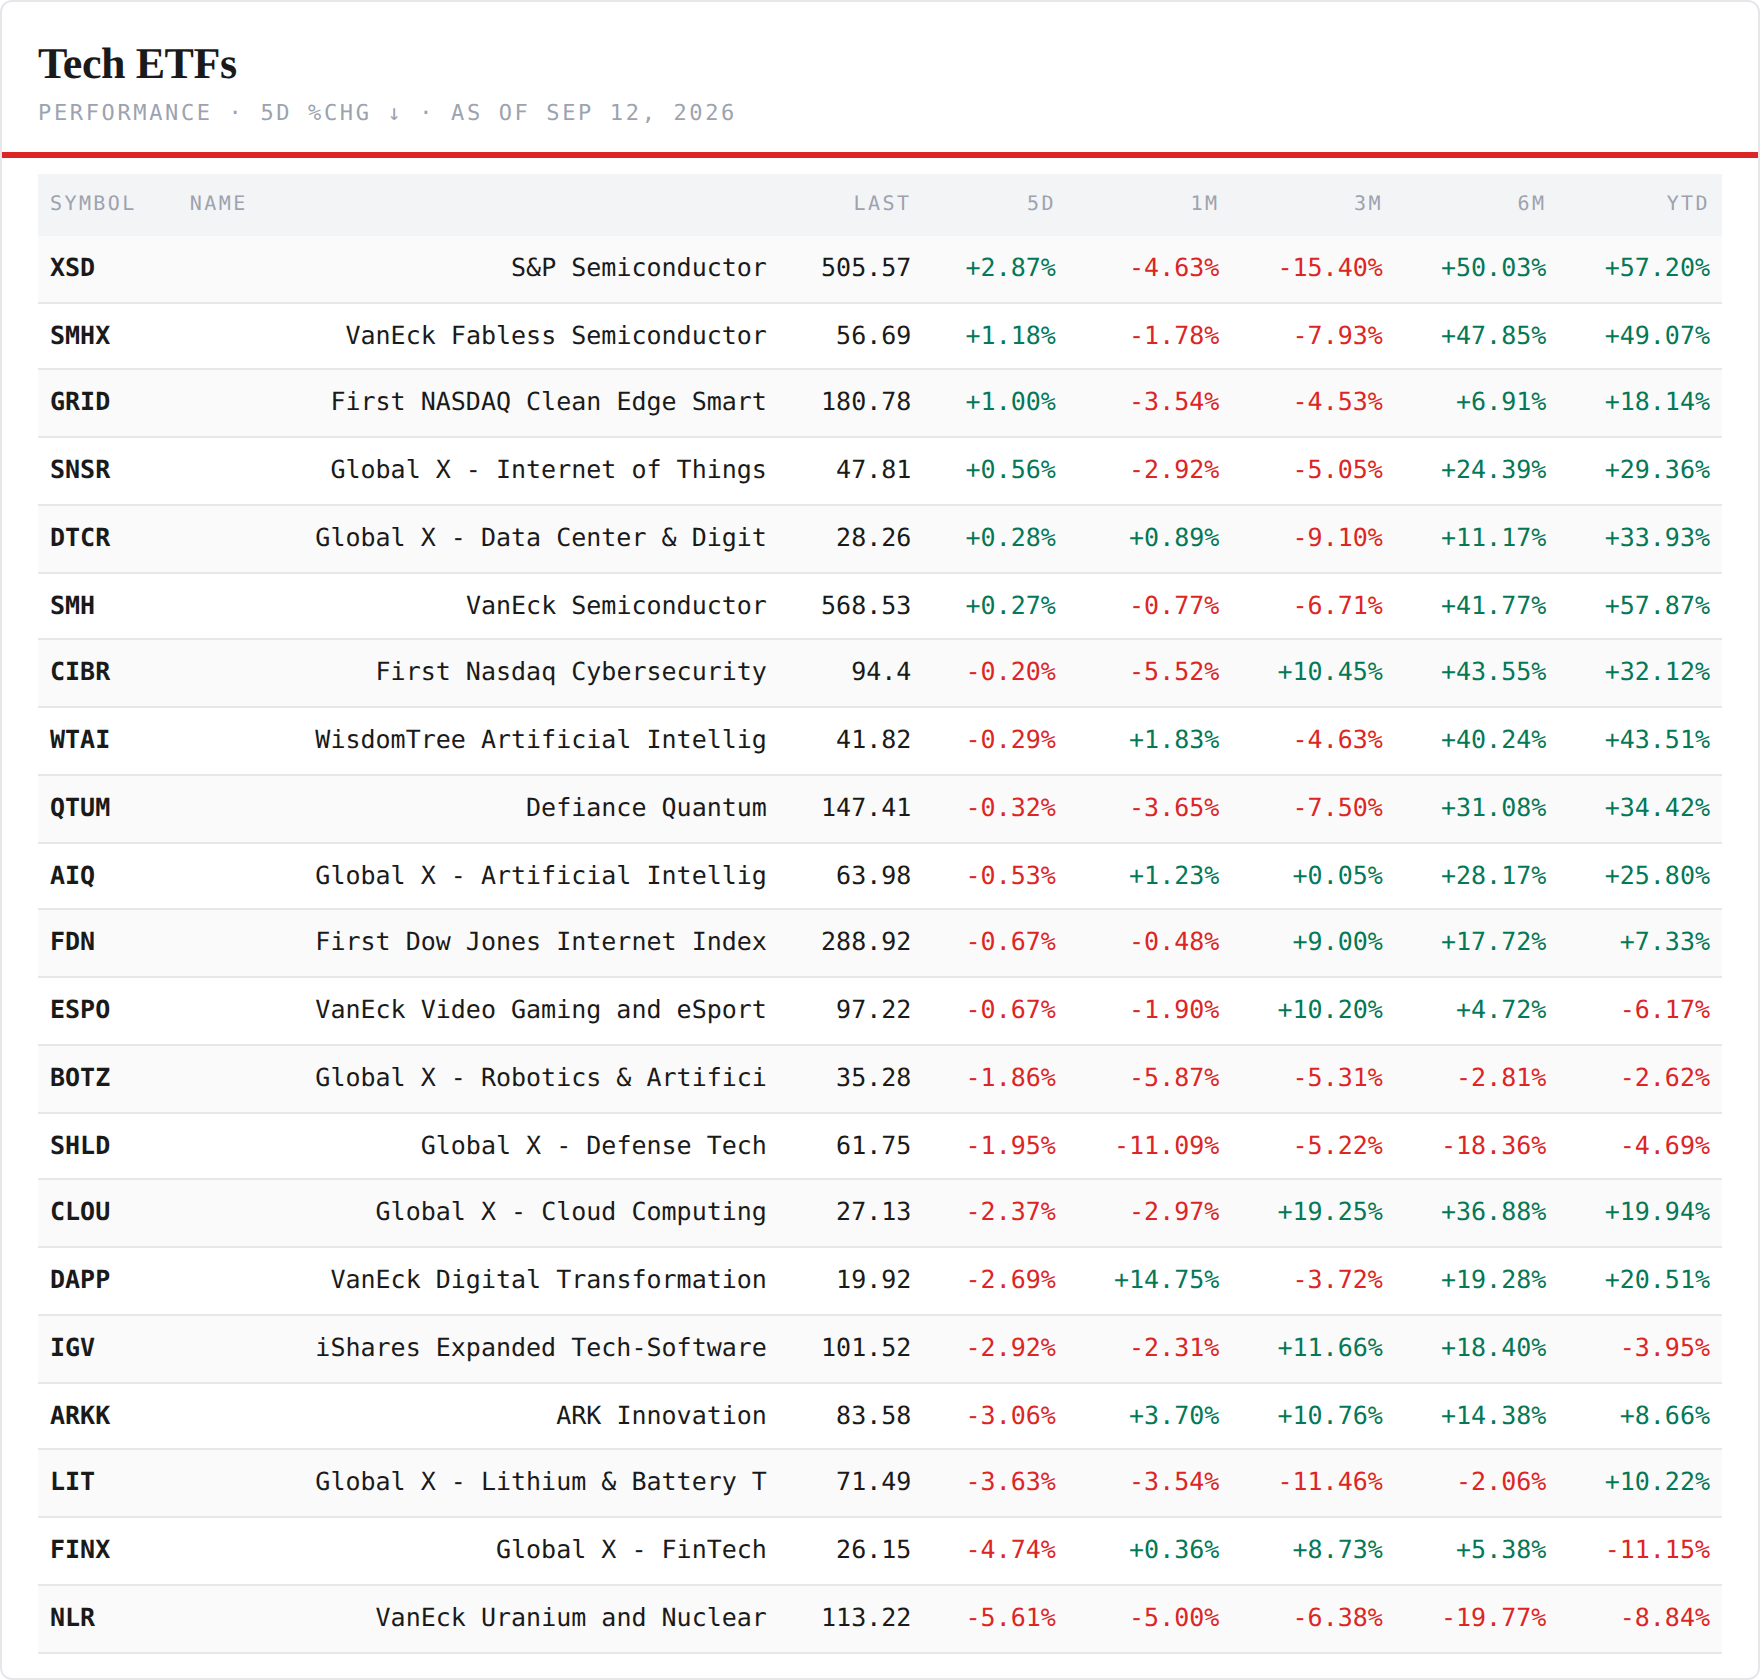
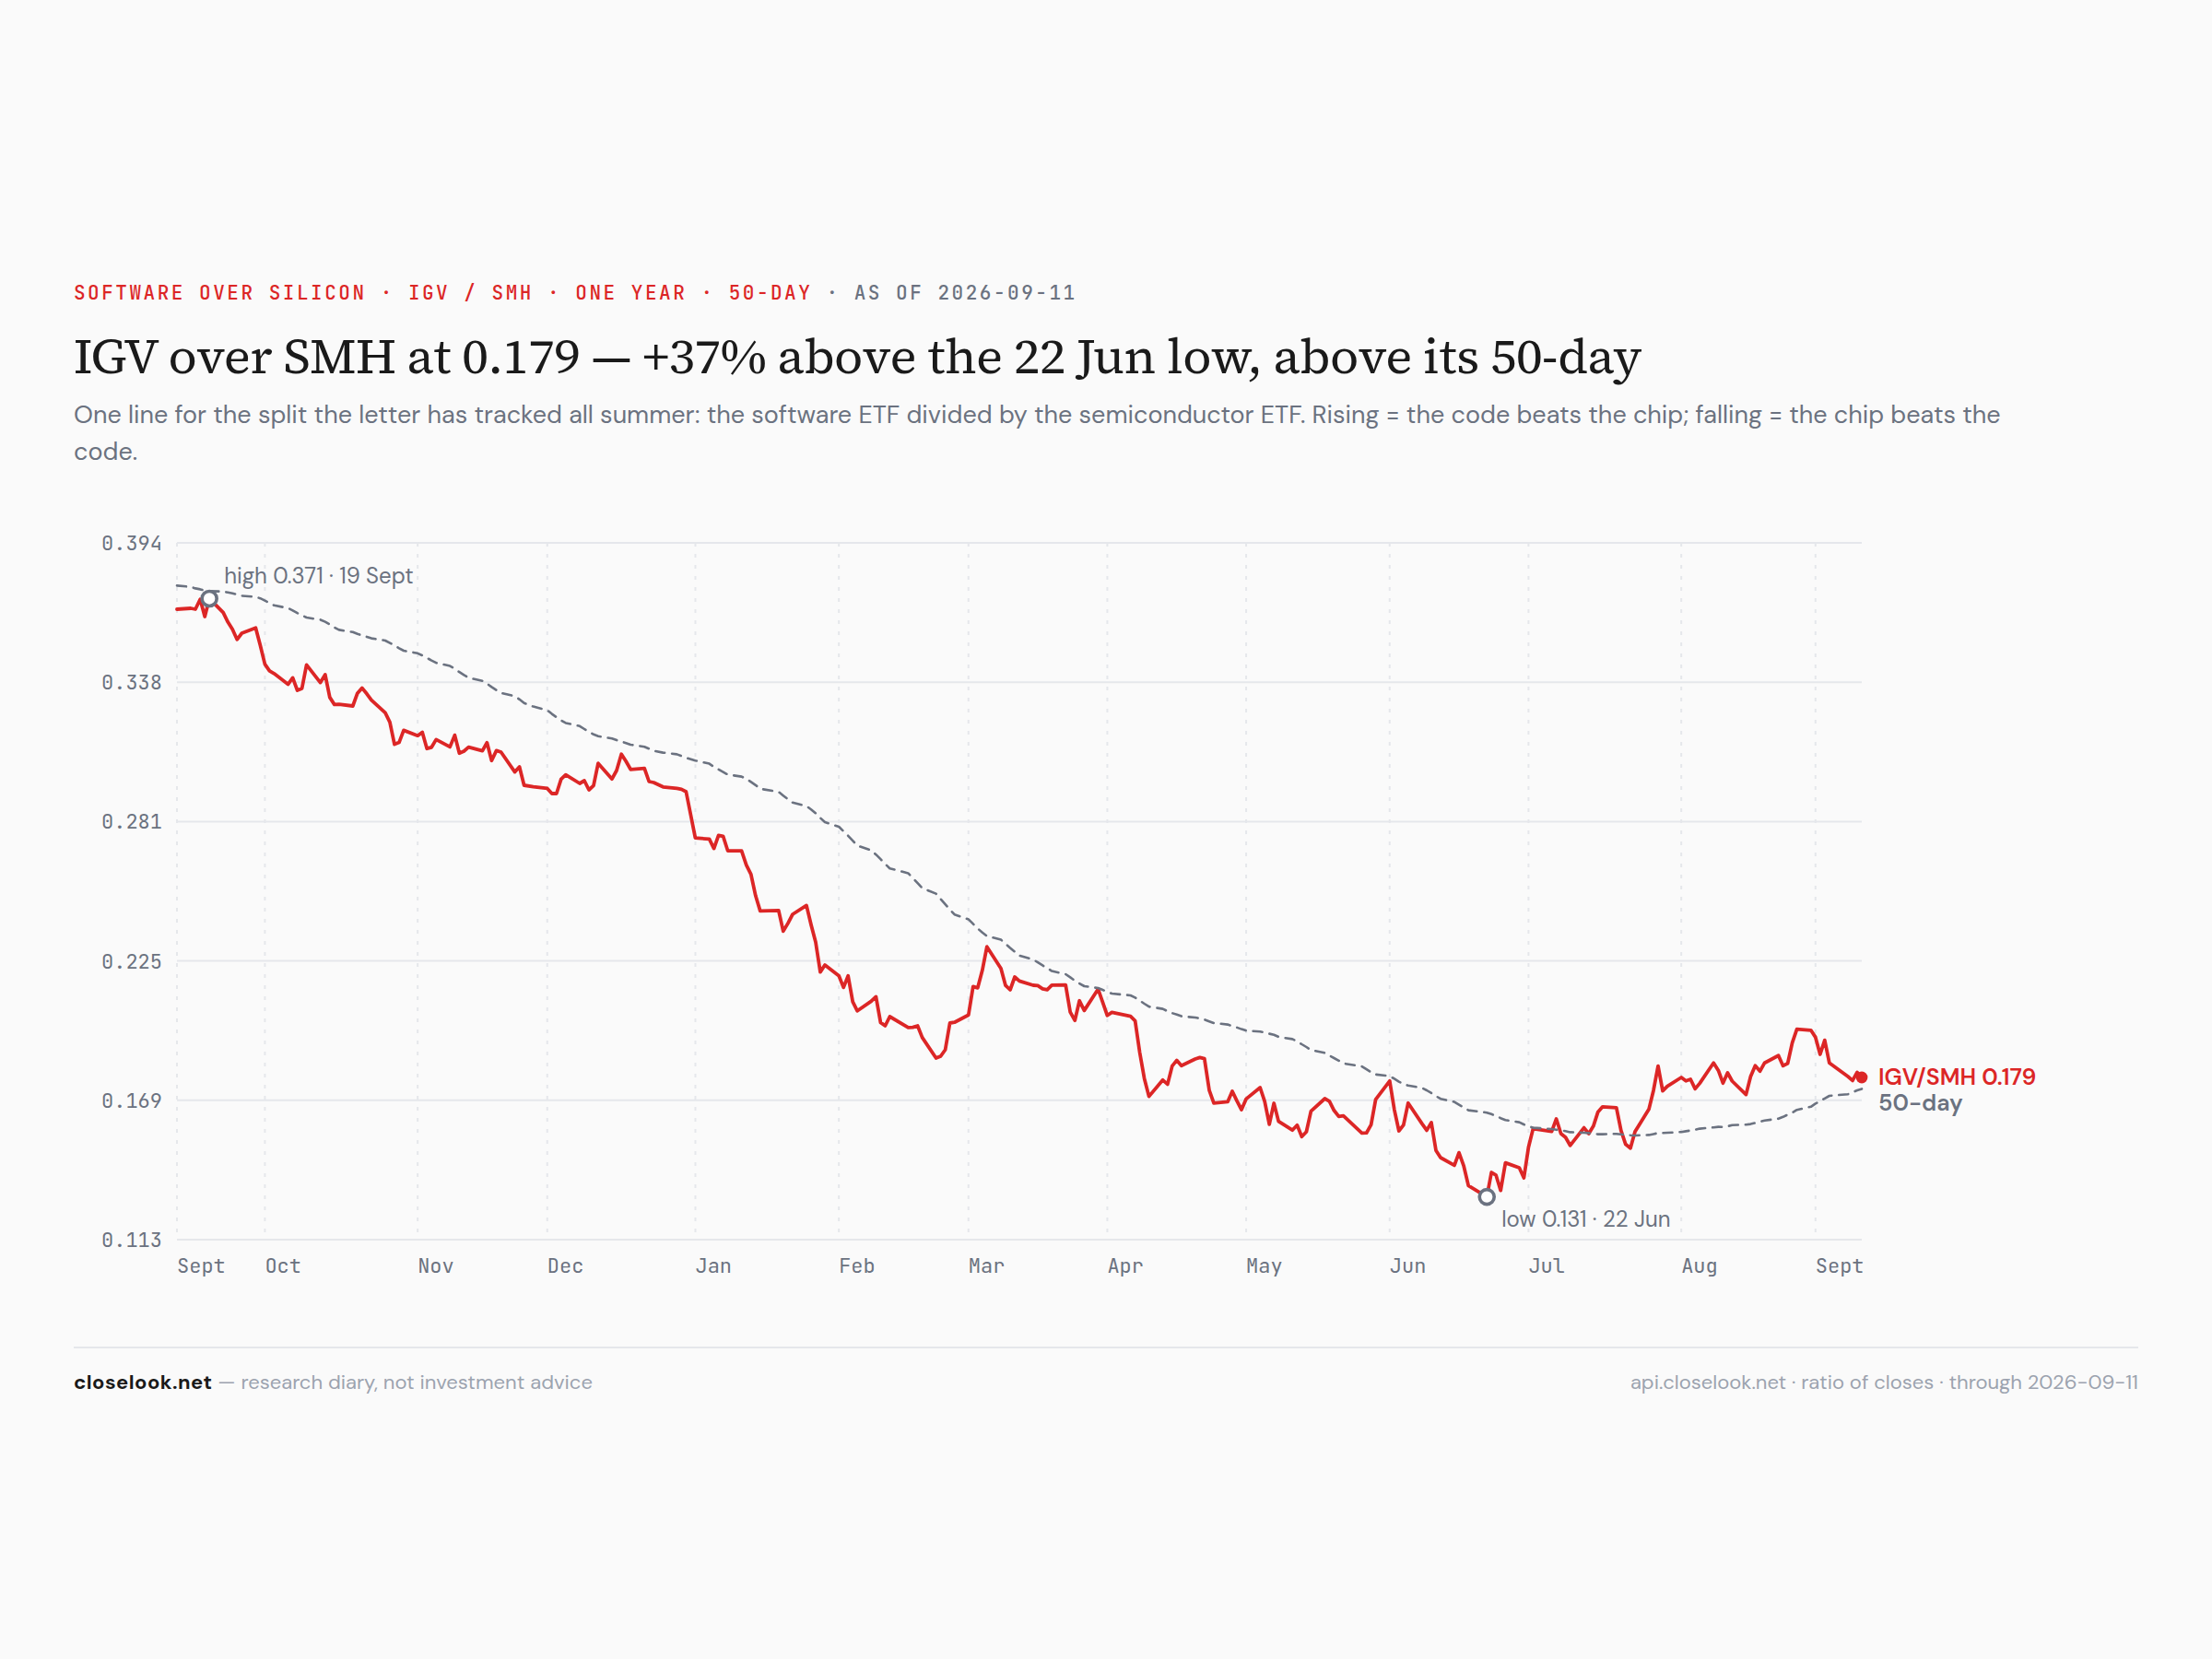
Because the money went where the number sent it — into the chip, and out of the code, a second week. Last week software −4.50% and the four semiconductor wrappers took the top of the tech board. This week the same sort, less violent on the surface and wider underneath: XSD +2.87%, SMHX +1.18%, SOXX +1.39%, SMH +0.27% — all four wrappers green on a board that had fifteen red lines of twenty-one — against IGV −2.92%, CLOU −2.37%, ARKK −3.06%, cybersecurity −0.20%. IGV's week, session by session: 102.66, 101.83, 101.20 — a sixth consecutive red close on Thursday — then +0.32% on Friday to 101.52. Red on the year by 3.95%, a second weekly close under the year-end line of 105.69, 8% under the August 27 high water. The pair board dates it: the software-to-semis ratio fell 3.18% on the week, from 41% above its June 22 low to 37% above it, after giving back 6.84% the week before. Ten percent of the ratio's rise, surrendered in two weeks, most of it in three sessions. The relative strength of the semi complex, measured against the index rather than against software: SOXX +1.39% against the S&P −0.77% this week, +2.21% against +0.11% the week before — four points of relative performance in two weeks, on a fund still 0.8% under its 50-day and 19.5% under its June high. The chips are leading the market without yet having reclaimed their own average. That is a consolidation being bought from the inside.
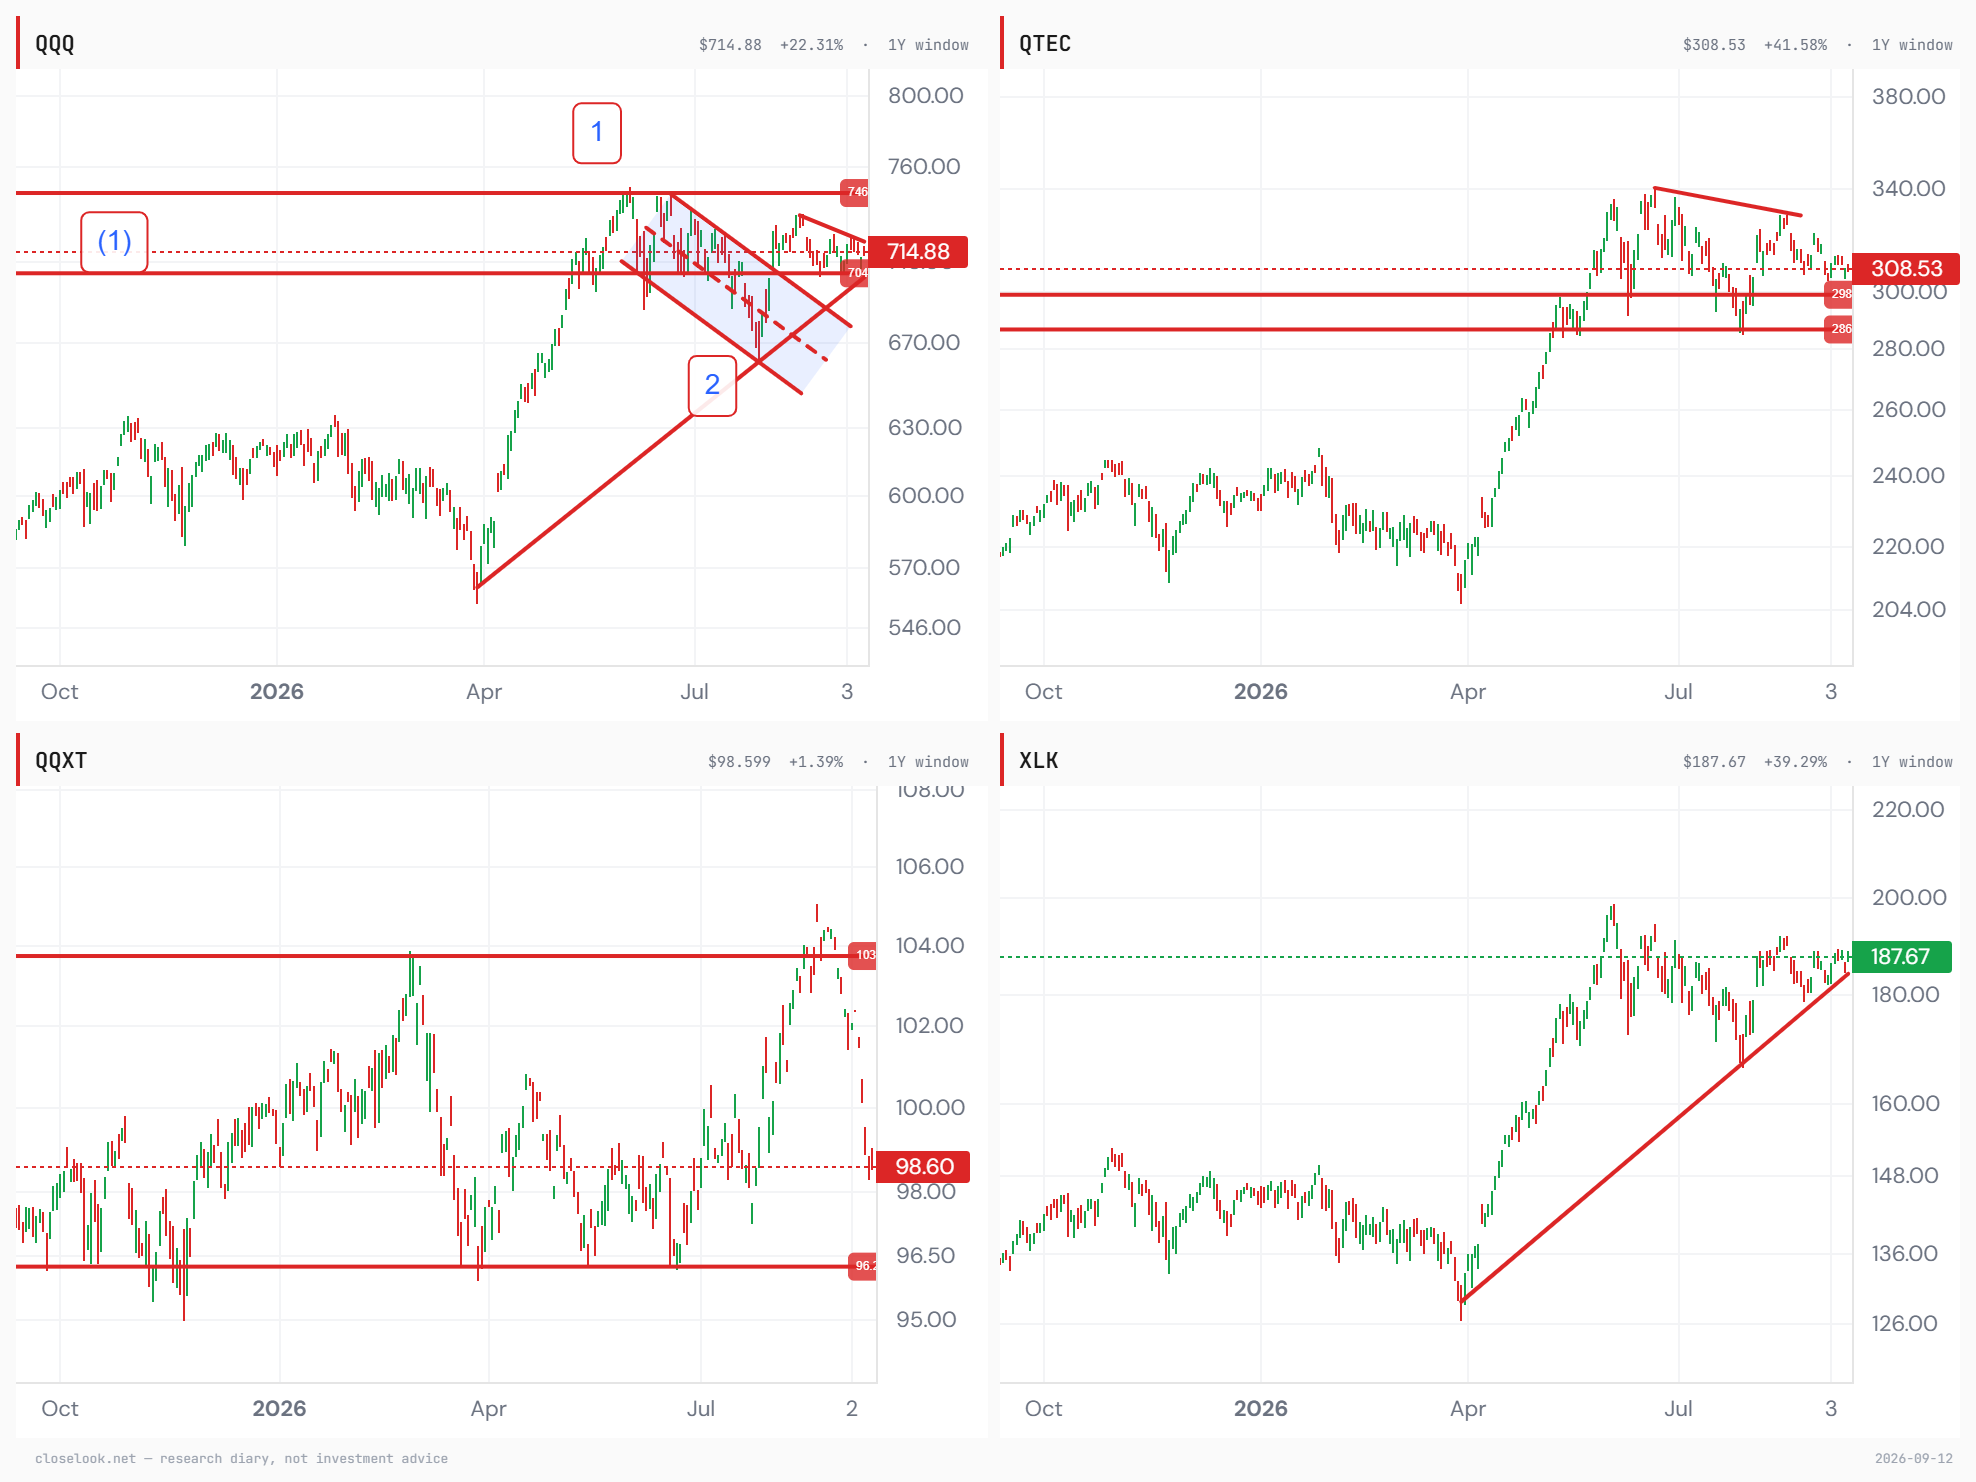
The same story on four charts — the index, its equal-weight tech sleeve, its ex-tech cut, and the technology sector. The house grid puts the four side by side on one year: the Nasdaq 100 in its range under the 746 line, on a short descending line from the mid-August high; the equal-weight tech sleeve at 308.53, under a descending line from its June high with 298 and 286 as the two shelves beneath; the ex-tech cut at 98.60, turned away from the 103 ceiling it touched in August and back in the middle of a range it has held for a year, with 96 the floor; and XLK at 187.67, sitting on the rising line from the April low — the only one of the four still on its trend. Four charts, one reading: the technology sector is the trend, the index is the range, and everything else in the index is a year of nothing.
Underneath it, the participation statistic held a third week, and this time the basket did what it had refused to do for five months: the Magnificent-7 basket +0.65% to 69.89 — a weekly close through the 69.5 shelf — against equal-weight's −1.89%. Composition: Meta +5.07%, Apple +3.84% a day before iPhone 18 Pro pre-orders, Tesla +3.21%; Alphabet flat; Amazon −0.67%, Microsoft −0.81%; Nvidia −5.24%, the basket's worst line and the only one to fall every session. Two weeks ago the re-concentration was into the balance sheets; last week into the two chip expressions; this week into the two consumer AI names, with the chip supplier as the casualty. Three weeks, three different carriers, one statistic: cap-weight over equal-weight, every week. The basket is not being bought for a thesis. It is being bought because it is the basket.

Inside tech — six green of twenty-one, and five of the six are silicon or the things it plugs into. XSD +2.87%, SMHX +1.18%, the grid fund +1.00%, the internet-of-things fund +0.56%, data centres +0.28%, SMH +0.27%. Fifteen red, and the bottom is the layer above the chip plus the things that fund it: nuclear −5.61%, fintech −4.74%, lithium −3.63%, ARK −3.06%, software −2.92%, the digital-asset fund −2.69% (the coin's week), cloud −2.37%, defense tech −1.95%. Two weeks ago the layer above the chip led with sixteen red beneath it; last week the exact inversion; this week the inversion held and narrowed — silicon green, everything else red, and the AI-themed basket and the quantum fund in between, within half a percent of flat. The three-week software-over-semis trend that this letter promoted to "axis" a fortnight ago has now been reversed for two weeks running, and the reversal has a shape: it is not the semis rising, it is the semis not falling while the index does.