Daily Pulse · · 4 min read · macro · TLT

In this edition
Yesterday was Kevin Warsh’s first FOMC as chair, and he planted a hawkish flag — a unanimous hold, the easing bias quietly dropped, half the dots now pencilling in a hike this year. The front page read it as hawkish. The bond market read it differently — and the bond market is the one with your money in it.
Rates stayed put at 3.50–3.75% (the fourth straight hold), but the message hardened: a unanimous vote, the easing bias gone, and a statement stripped back to a single line — the Committee will deliver price stability. That’s the front-page read. The more interesting read is in the curve — and the curve isn’t agreeing.
The curve is splitting
Put four ETFs across the maturity spectrum side by side and the disagreement is visible:
- BSV — short-term — ~77.6
- IEI — 3–7y Treasuries — ~117
- IEF — 7–10y Treasuries — ~94
- TLT — 20+y Treasuries — ~86, sitting just above its multi-year ~79 floor
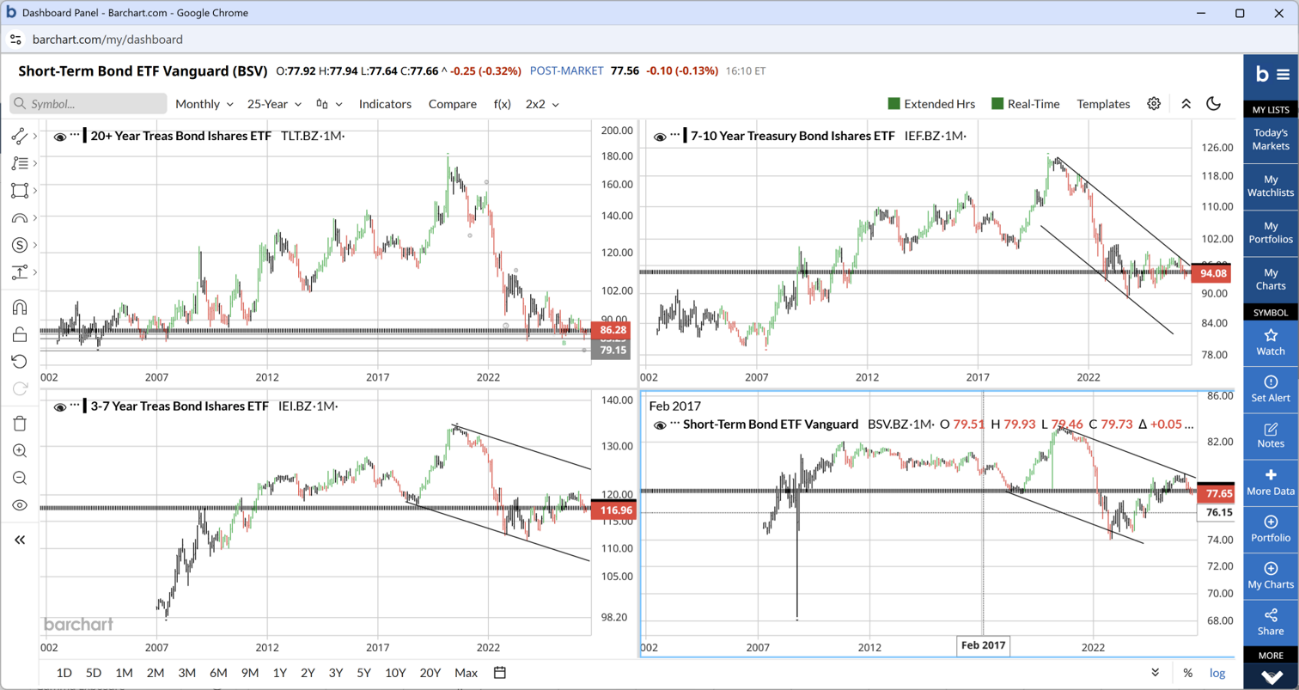
The short end and the belly — BSV, IEI, IEF — are rolling over against descending trendlines. In price terms that’s a top; in yield terms it means the market is letting the front and middle of the curve reprice higher — exactly where a hawkish Fed has leverage.
TLT is doing the opposite. After a three-year bear market from ~180 to the mid-80s, it’s trying to base near the lows. A price bottom at the long end is a top in long-term rates. The 20-year part of the curve is telling you it does not believe it needs to go meaningfully higher.
So: front and belly up in yield, long end capped. A bear flattening led by the front — not a parallel shift, not a long-end blow-out.
C — free account
The free C account unlocks the full Daily Pulse — every section of this read.
One tap with Google or one email — no password, no card. You are signed in until you sign out, on this browser, from then on.
Join the Look — freeAlready joined on this browser? The full edition shows automatically — if it doesn't, sign in again here. Looking for the archive, portfolios and realtime? That is C+.