What is Adobe Inc. (ADBE)?
Adobe Inc. trades as ADBE on the US exchange (US) and is classified under Technology in the Closelooknet research universe, as of the registry build of 2026-11-11.
Is ADBE in a Closelooknet index?
Not currently — Adobe Inc. is tracked in the Closelooknet research universe but is not a constituent of a Closelooknet functional index as of 2026-11-11.
What is Adobe Inc.'s Closelooknet composite score?
67 out of 100, with momentum 41, quality 92 and valuation 72 sub-scores, as of 2026-11-11. Scores are Closelooknet's own research readings, not ratings or investment advice.
What is Adobe Inc.'s earnings print record?
Across the 11 prints Closelooknet covers, Adobe Inc. beat EPS estimates 11 times and revenue estimates 11 times; the three-day reactions split 2 up, 2 flat and 7 down (moves beyond ±3%), as of the 2026-09-02 card. The full print-record card carries the per-print history.
Where does ADBE trade against its moving averages?
Adobe Inc. trades 5.1% below its 50-day and 4.6% below its 200-day moving average (4.9% below its 20-day). As of 2026-11-09 — a technical state from the nightly Closelooknet bake, not advice. The Technical tab carries the full row.
How is ADBE doing against its Closelooknet index?
Over the past month Adobe Inc. is −0.6% against −2.1% for the Agentic Winners 40 — 1.5 points ahead of its index, as of 2026-11-10. Its Application Leaders sleeve is +4.3% over the same month. The “Versus its index” table on this page carries the day, the week and the month for the name, its sleeve and the index.
How does Adobe Inc. compare with its peers?
Against its peer group (Creative and business software), Adobe Inc. (ADBE) sits 34.7% below its 52-week high, 5.1% below its 50-day average; Salesforce Inc (CRM) is 19.9% below, Microsoft Corporation (MSFT) is 2.5% below, Intuit Inc (INTU) is 50.7% below, as of 2026-11-09. Put any of them next to ADBE in the chart grid (2×1 or 2×2) and the page lays the companies side by side: performance, trend, valuation, margins and our money-flow reading.
How does Adobe Inc. trade when bond yields rise?
Over the past year Adobe Inc. had a beta of 0.40 to TLT, the long-dated Treasury fund — it shows only a loose link to bond moves, higher than 29% of US names. On the 10 sessions in which long bonds fell most it moved +0.88% on average, against −0.72% for the S&P 500. As of 2026-11-10; The "How it trades on rate days" block on this page carries the lines.
What does Adobe Inc. do?
Adobe sells software for creating and managing digital content and customer experiences, split across three lines: Digital Media covers tools for photographers, video editors and designers to make, publish and promote content; Digital Experience gives brands and marketers a platform to plan, run and measure campaigns; and a smaller Publishing and Advertising line covers e-learning, document tools and Adobe's advertising business. It also has a partnership with HUMAIN to build generative AI models and AI-powered applications. The company is based in San Jose and sells mainly through its own website, app stores and resellers. Closelooknet's peer group for Adobe is built around creative and business software, putting it alongside Salesforce, Microsoft, Intuit and Autodesk; the market also weighs it against Figma as a design-tools rival. (Company snapshot of 2026-09-17.)
Where does Adobe Inc. sit in the AI build-out?
Adobe carries no seat in Rubin, our AI build-out index. It sits in the Technology sector, in the Software - Application industry, the applications software sleeve of the wider universe the diary tracks. Adobe sits in the Nasdaq-100 and carries a Closelooknet score across three modules so far, with quality reading as the strongest and momentum as the weakest. The diary has quoted it in a Dossier mapping software firms against AI disruption risk and in a Weekly Signal tracking its share-price drawdown, and returns to it often given how many times its name comes up across our coverage. (Company snapshot of 2026-09-17.)
Does Adobe Inc. pay a dividend?
No cash distribution shows in Adobe Inc.’s price series over the last three years. In fiscal 2025 the company bought back 11.3 bn USD of its own shares, 115% of that year’s free cash flow. The share count fell 8.2% over the fiscal year. As of 2026-11-10; the "Dividends and capital return" block on this page carries the lines.
What has Wall Street done on Adobe Inc. recently?
The most recent analyst action on Adobe Inc. on the Closelooknet wire is a price target by UBS on 2026-09-11 (target 255 from 225). 8 actions on the analyst wire since 2026-08-13: 8 target changes. Its latest earnings print on the wire, 2026-09-10: EPS 6.13 against 6.08 expected — a +0.8% beat. Analyst actions are third-party opinions recorded by the wire, not Closelooknet readings. The “The Street on this name” block on this page lists the moves; the full feeds are the analyst wire and the earnings wire.
What does this page show?
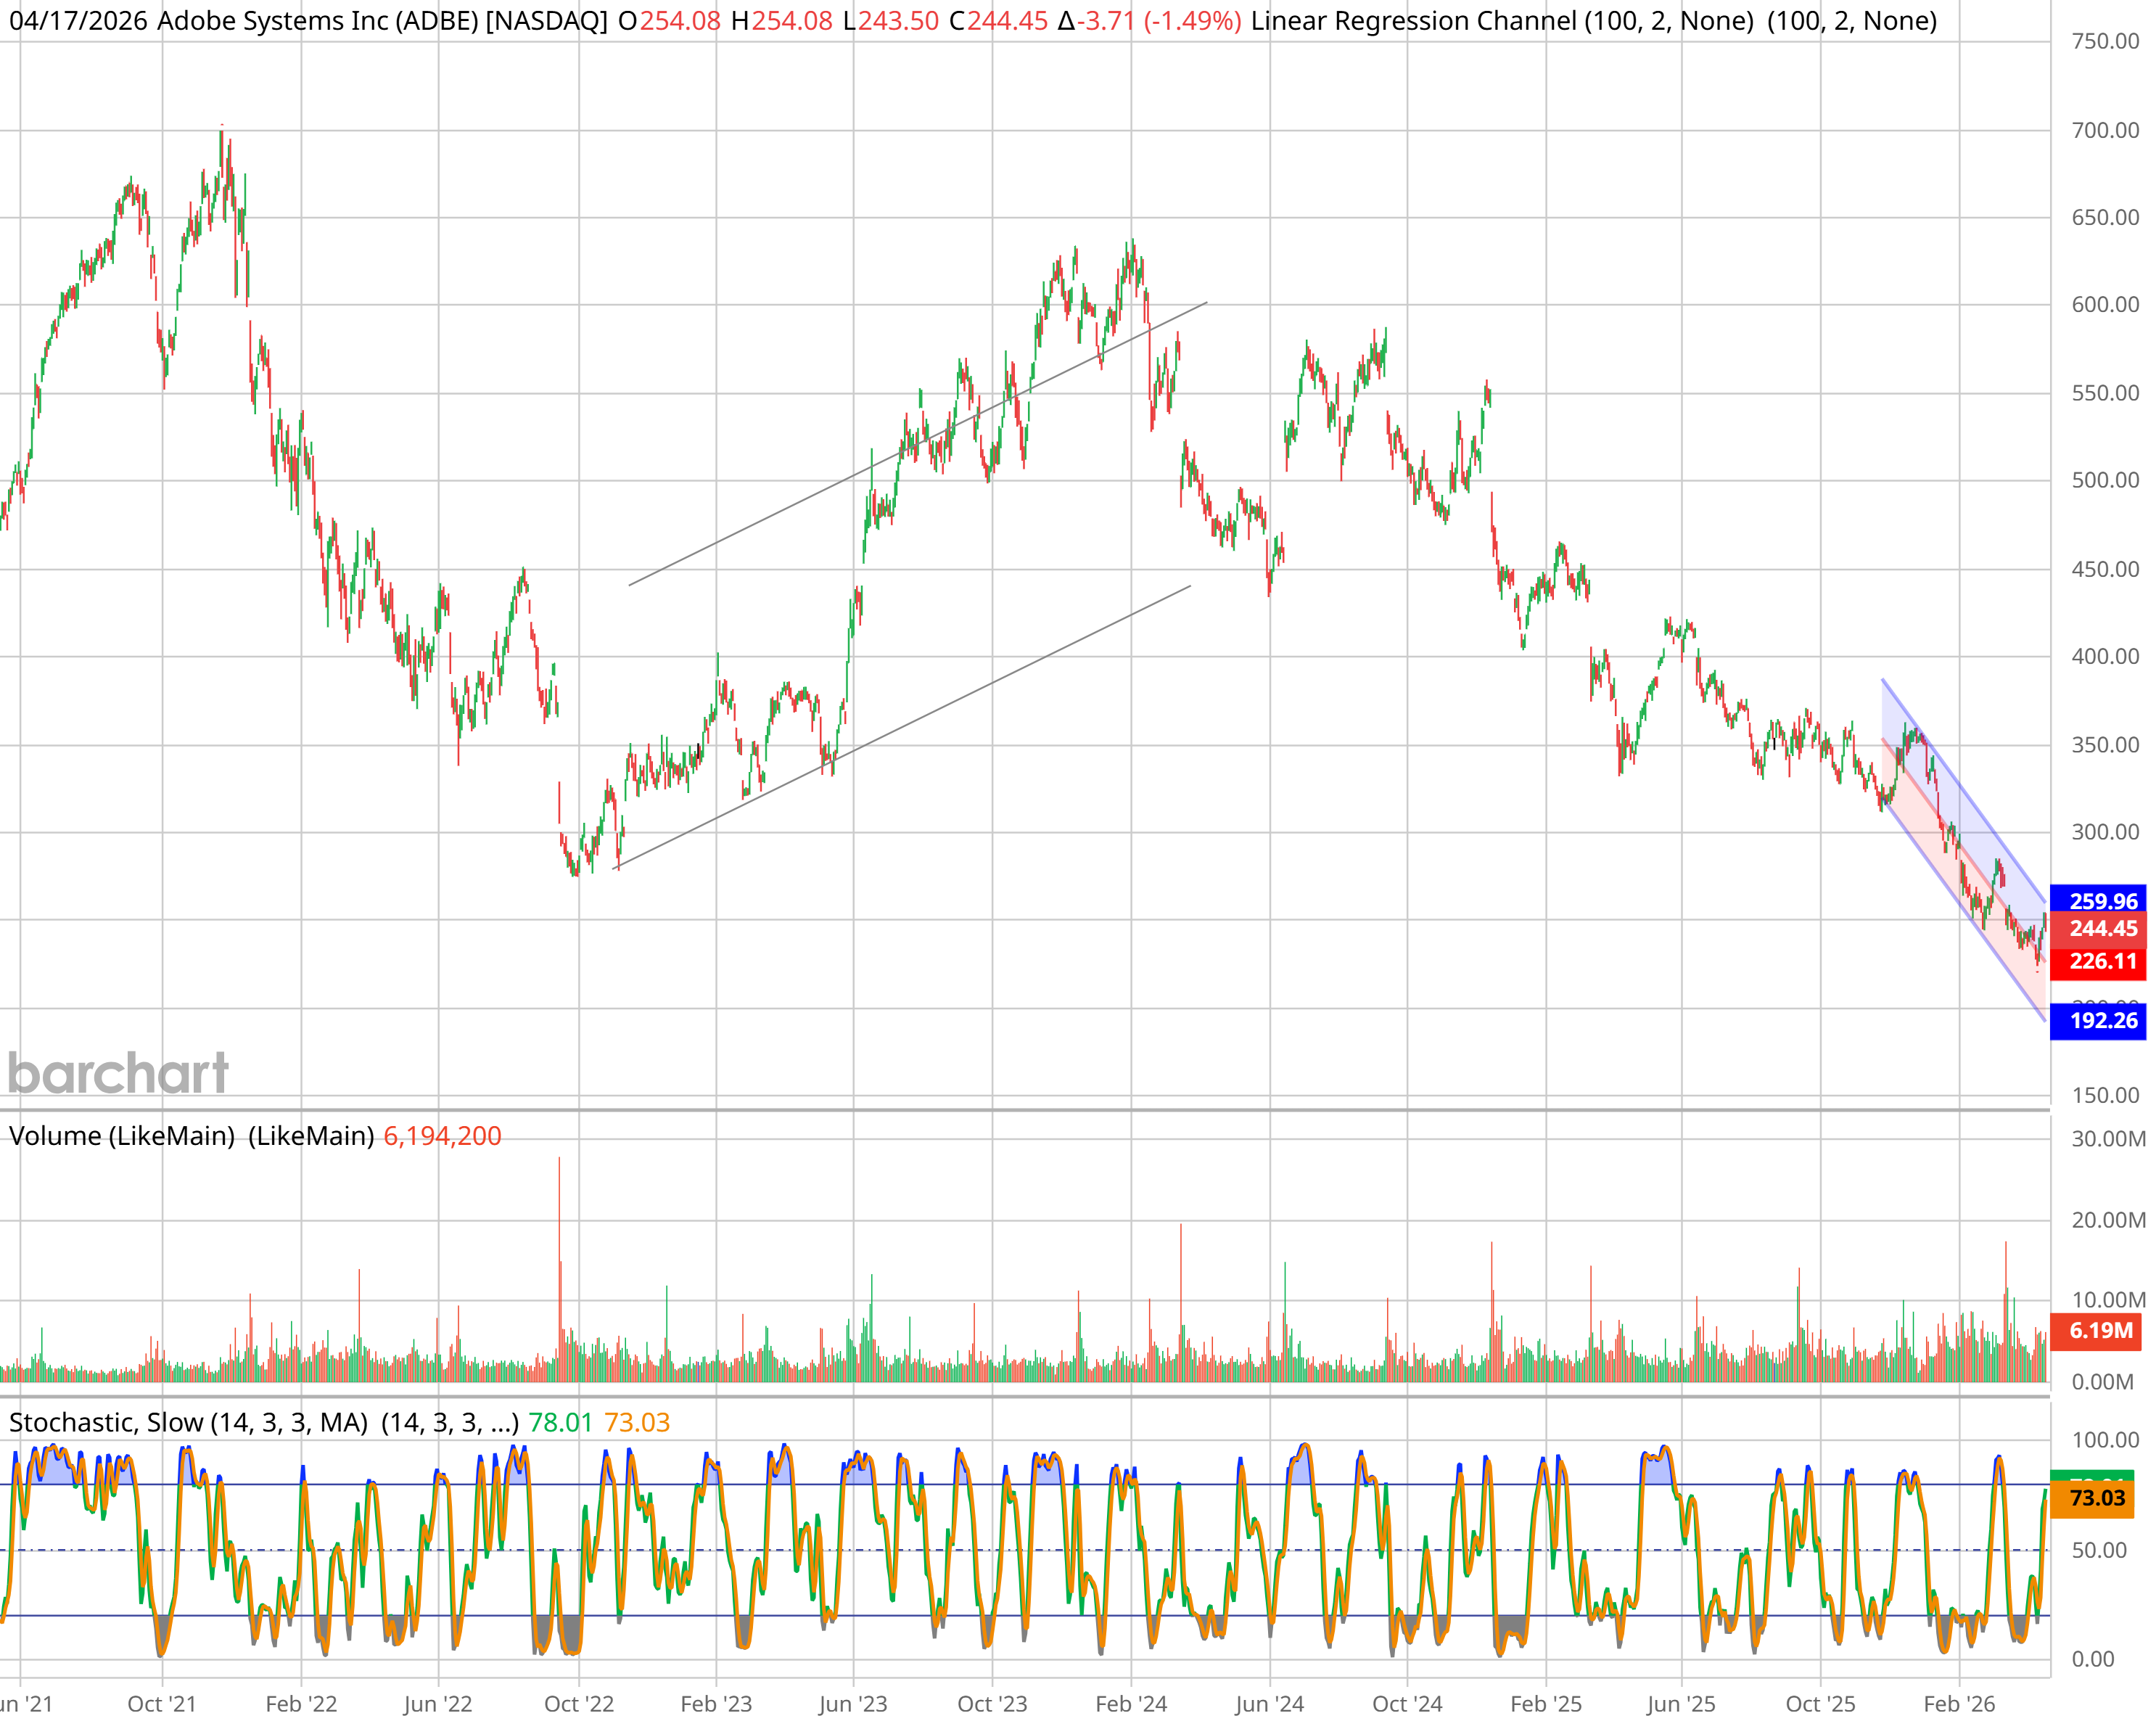
A live price chart with SMA overlays and drawing tools for ADBE, performance metrics, index-membership context and the Closelooknet structure read — an investment research diary view, not investment advice.