Source page — copy text into Substack/LinkedIn, upload the visuals. noindex · not public

Closelook@US Stock Markets · Weekly Edition
Chip Stocks — Down 13% in a Week, Under the Floor That Held Twice; the Average Stock Barely Moved
The companies that build AI broke the floor they had held since the summer. The chip fund fell 13.1 percent, 12.2 of it on Thursday, and closed 37.5 percent under its June high; the AI build-out index closed under the zone that had held twice and under the 61.8 percent line of its 2026 rally. The average stock barely moved — the equal-weight S&P fell 1.0 percent and is up 12.8 percent on the year, health care is 14.9 points ahead of the index over a month, and the index of companies that use AI made a new high on Wednesday. The Nasdaq 100 fell 4.9 percent, under its July low; the S&P held its 200-day line by 0.7 percent; fourteen print windows closed, and two paid.
Closelooknet is a reader-supported publication — to receive new posts and support the work, become a free or paid subscriber.
1 · This Week's Action
The builders broke their floor; the average stock barely moved. Last week this letter told two stories. Story one, relative strength, held: health care is 14.9 points ahead of the S&P over a month, and the index of companies that use AI rose 0.7% and made a new high on Wednesday. Story two, a bottom, failed. The AI build-out index had held the zone between 1,704 and 1,735 twice. On Thursday it closed at 1,473.67 — under that zone, and under the 61.8% retracement of its 2026 rally at 1,559.55. It ended the week at 1,485.88, down 13.2%. The chip fund SOXX fell 13.1%; the equal-weight S&P, in which every company counts the same, fell 1.0%. §3 reads the indices. First, the tape.
The index. The Nasdaq 100 fell 4.91% on the week to 26,990 — under the July low close of 27,192, the shelf last week's letter named. It sits 13.6% under its October 6 record of 31,224. The fund closed at 656.10, 9.0% under its 50-day average and 3.6% under its 200-day. The S&P 500 fell 2.68% to 7,377, 5.7% under its record of 7,819; the fund closed at 735.29, 4.0% under its 50-day and 0.7% above its 200-day — the one long line it still holds.
Most of it came on Thursday. The Nasdaq 100 fund walked −1.4%, +0.6%, +1.0%, −6.5%, +1.4%; the S&P fund −0.5%, +0.3%, +1.7%, −4.4%, +0.3%; the chip fund −3.8%, +2.5%, −3.1%, −12.2%, +3.5%. Wednesday's election result lifted the S&P; Thursday's three blows to the AI builders took it back and more. §2 has the order.
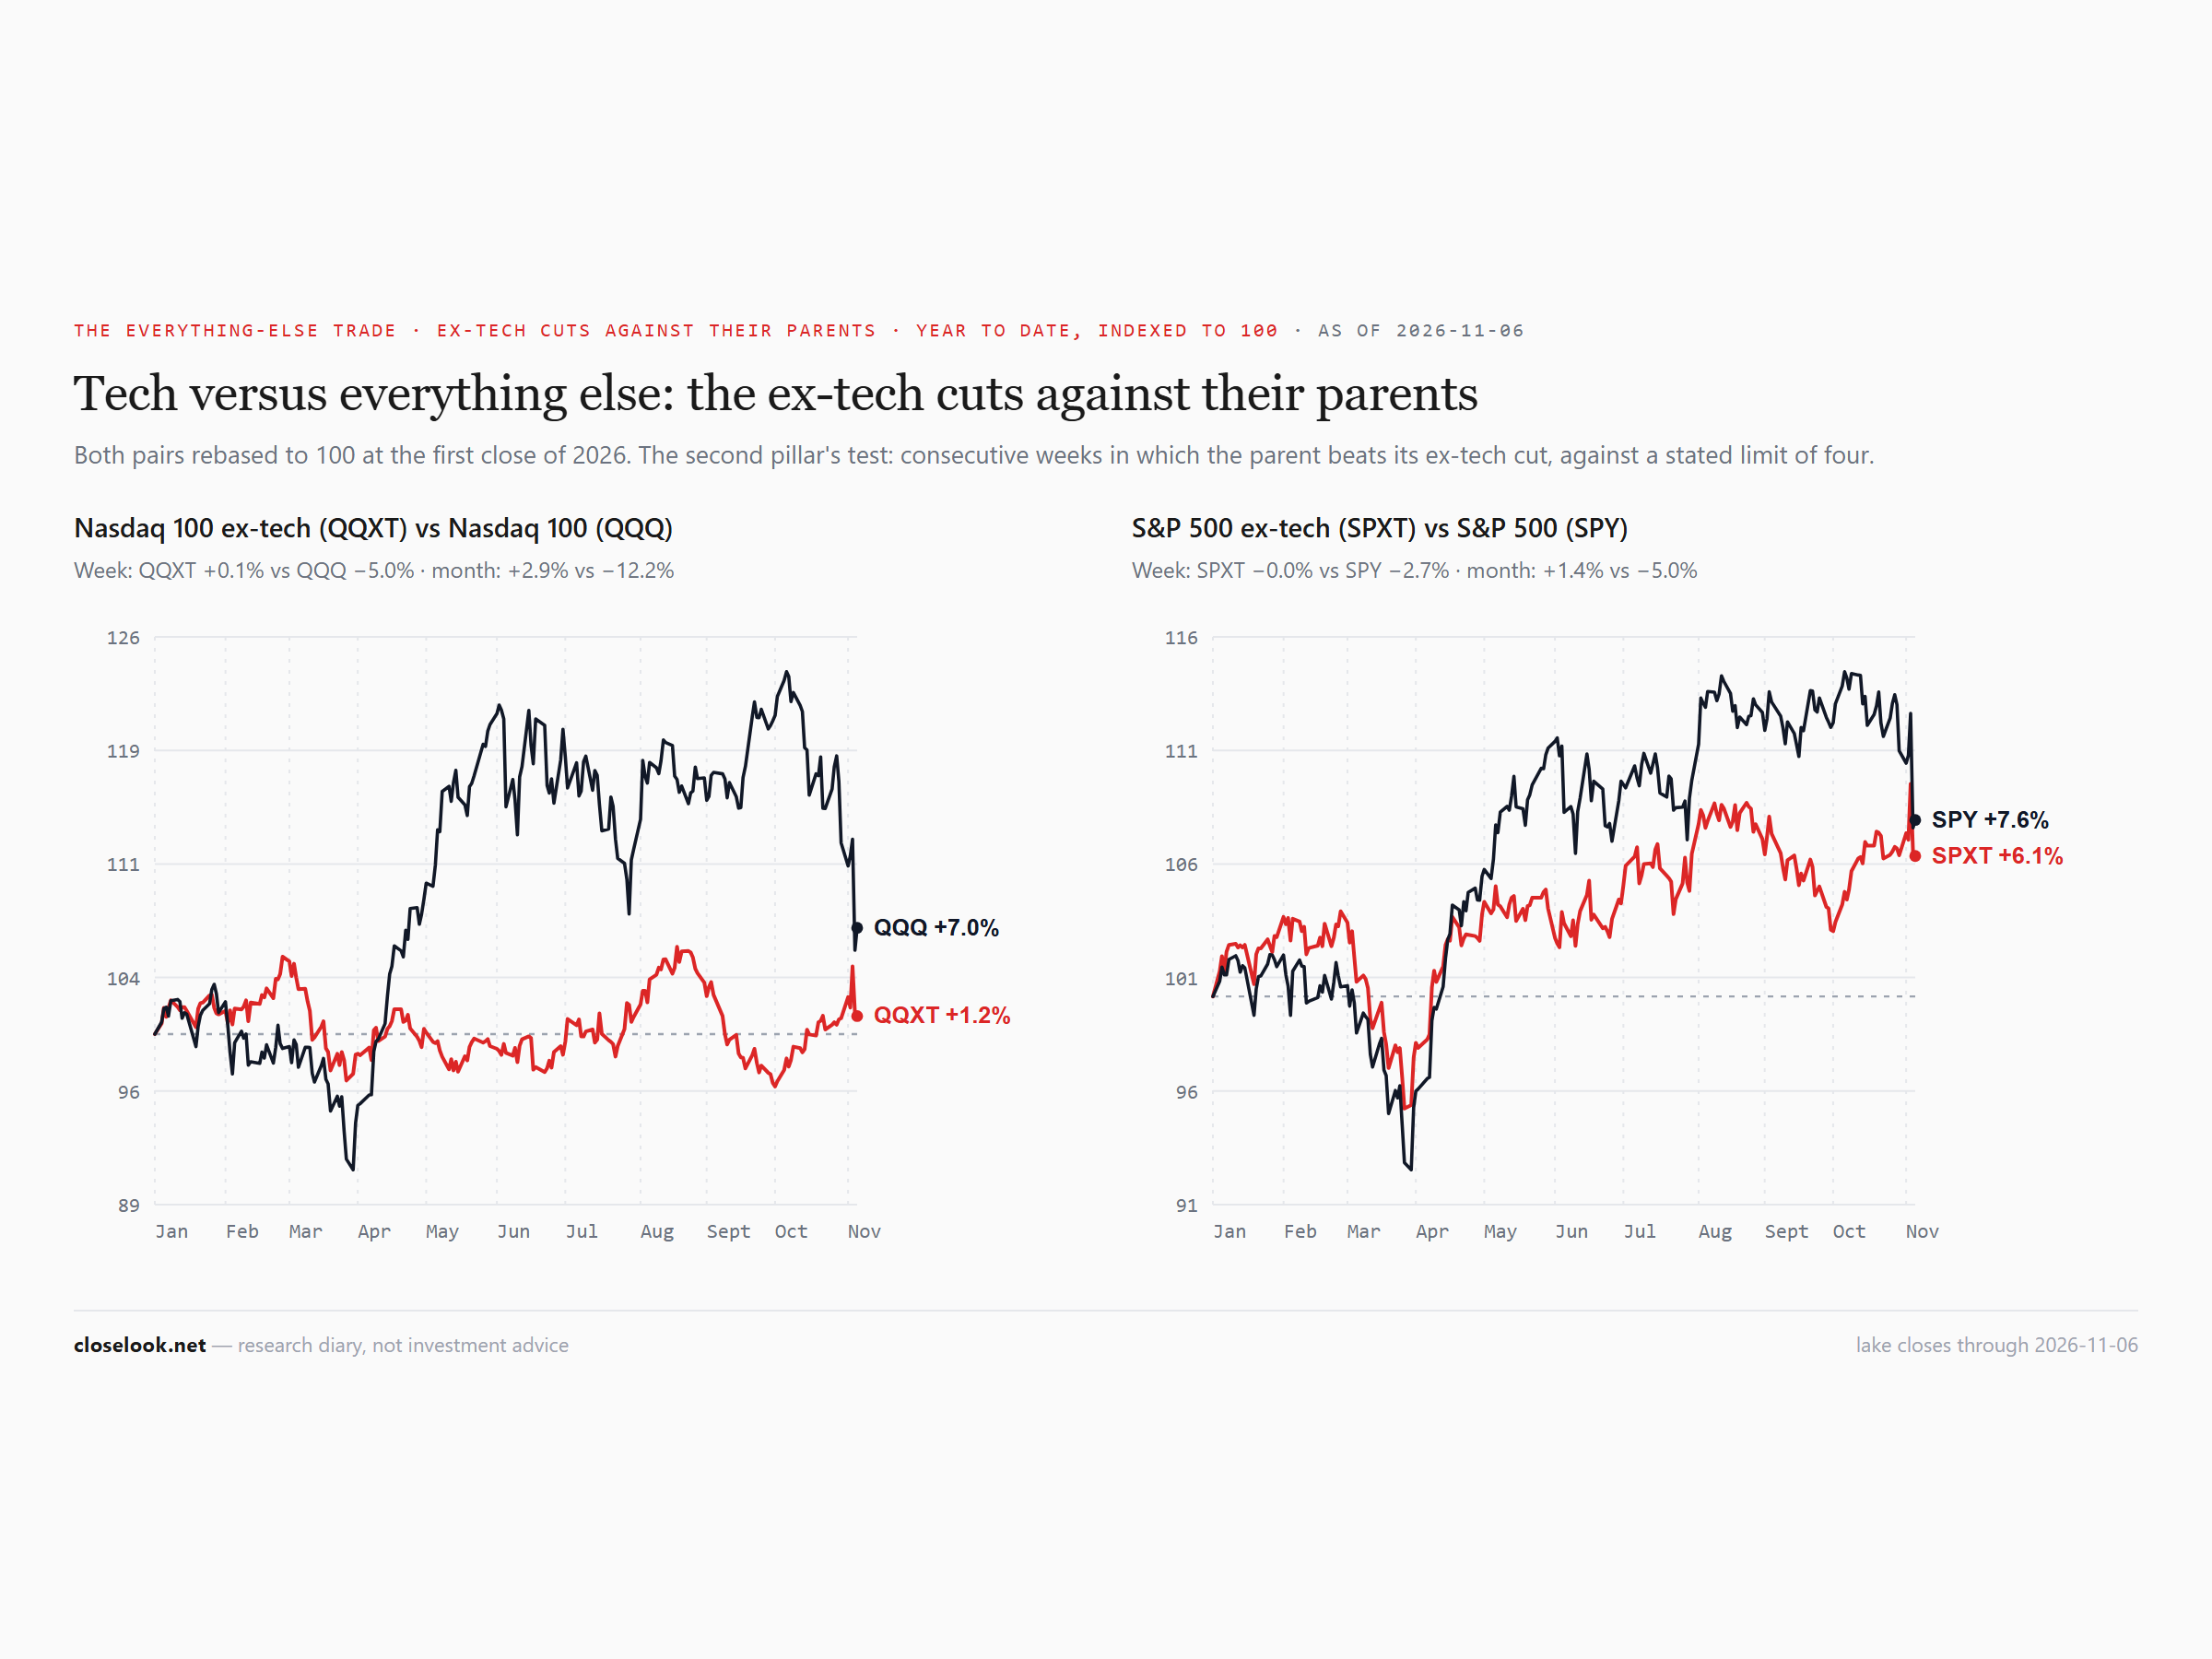
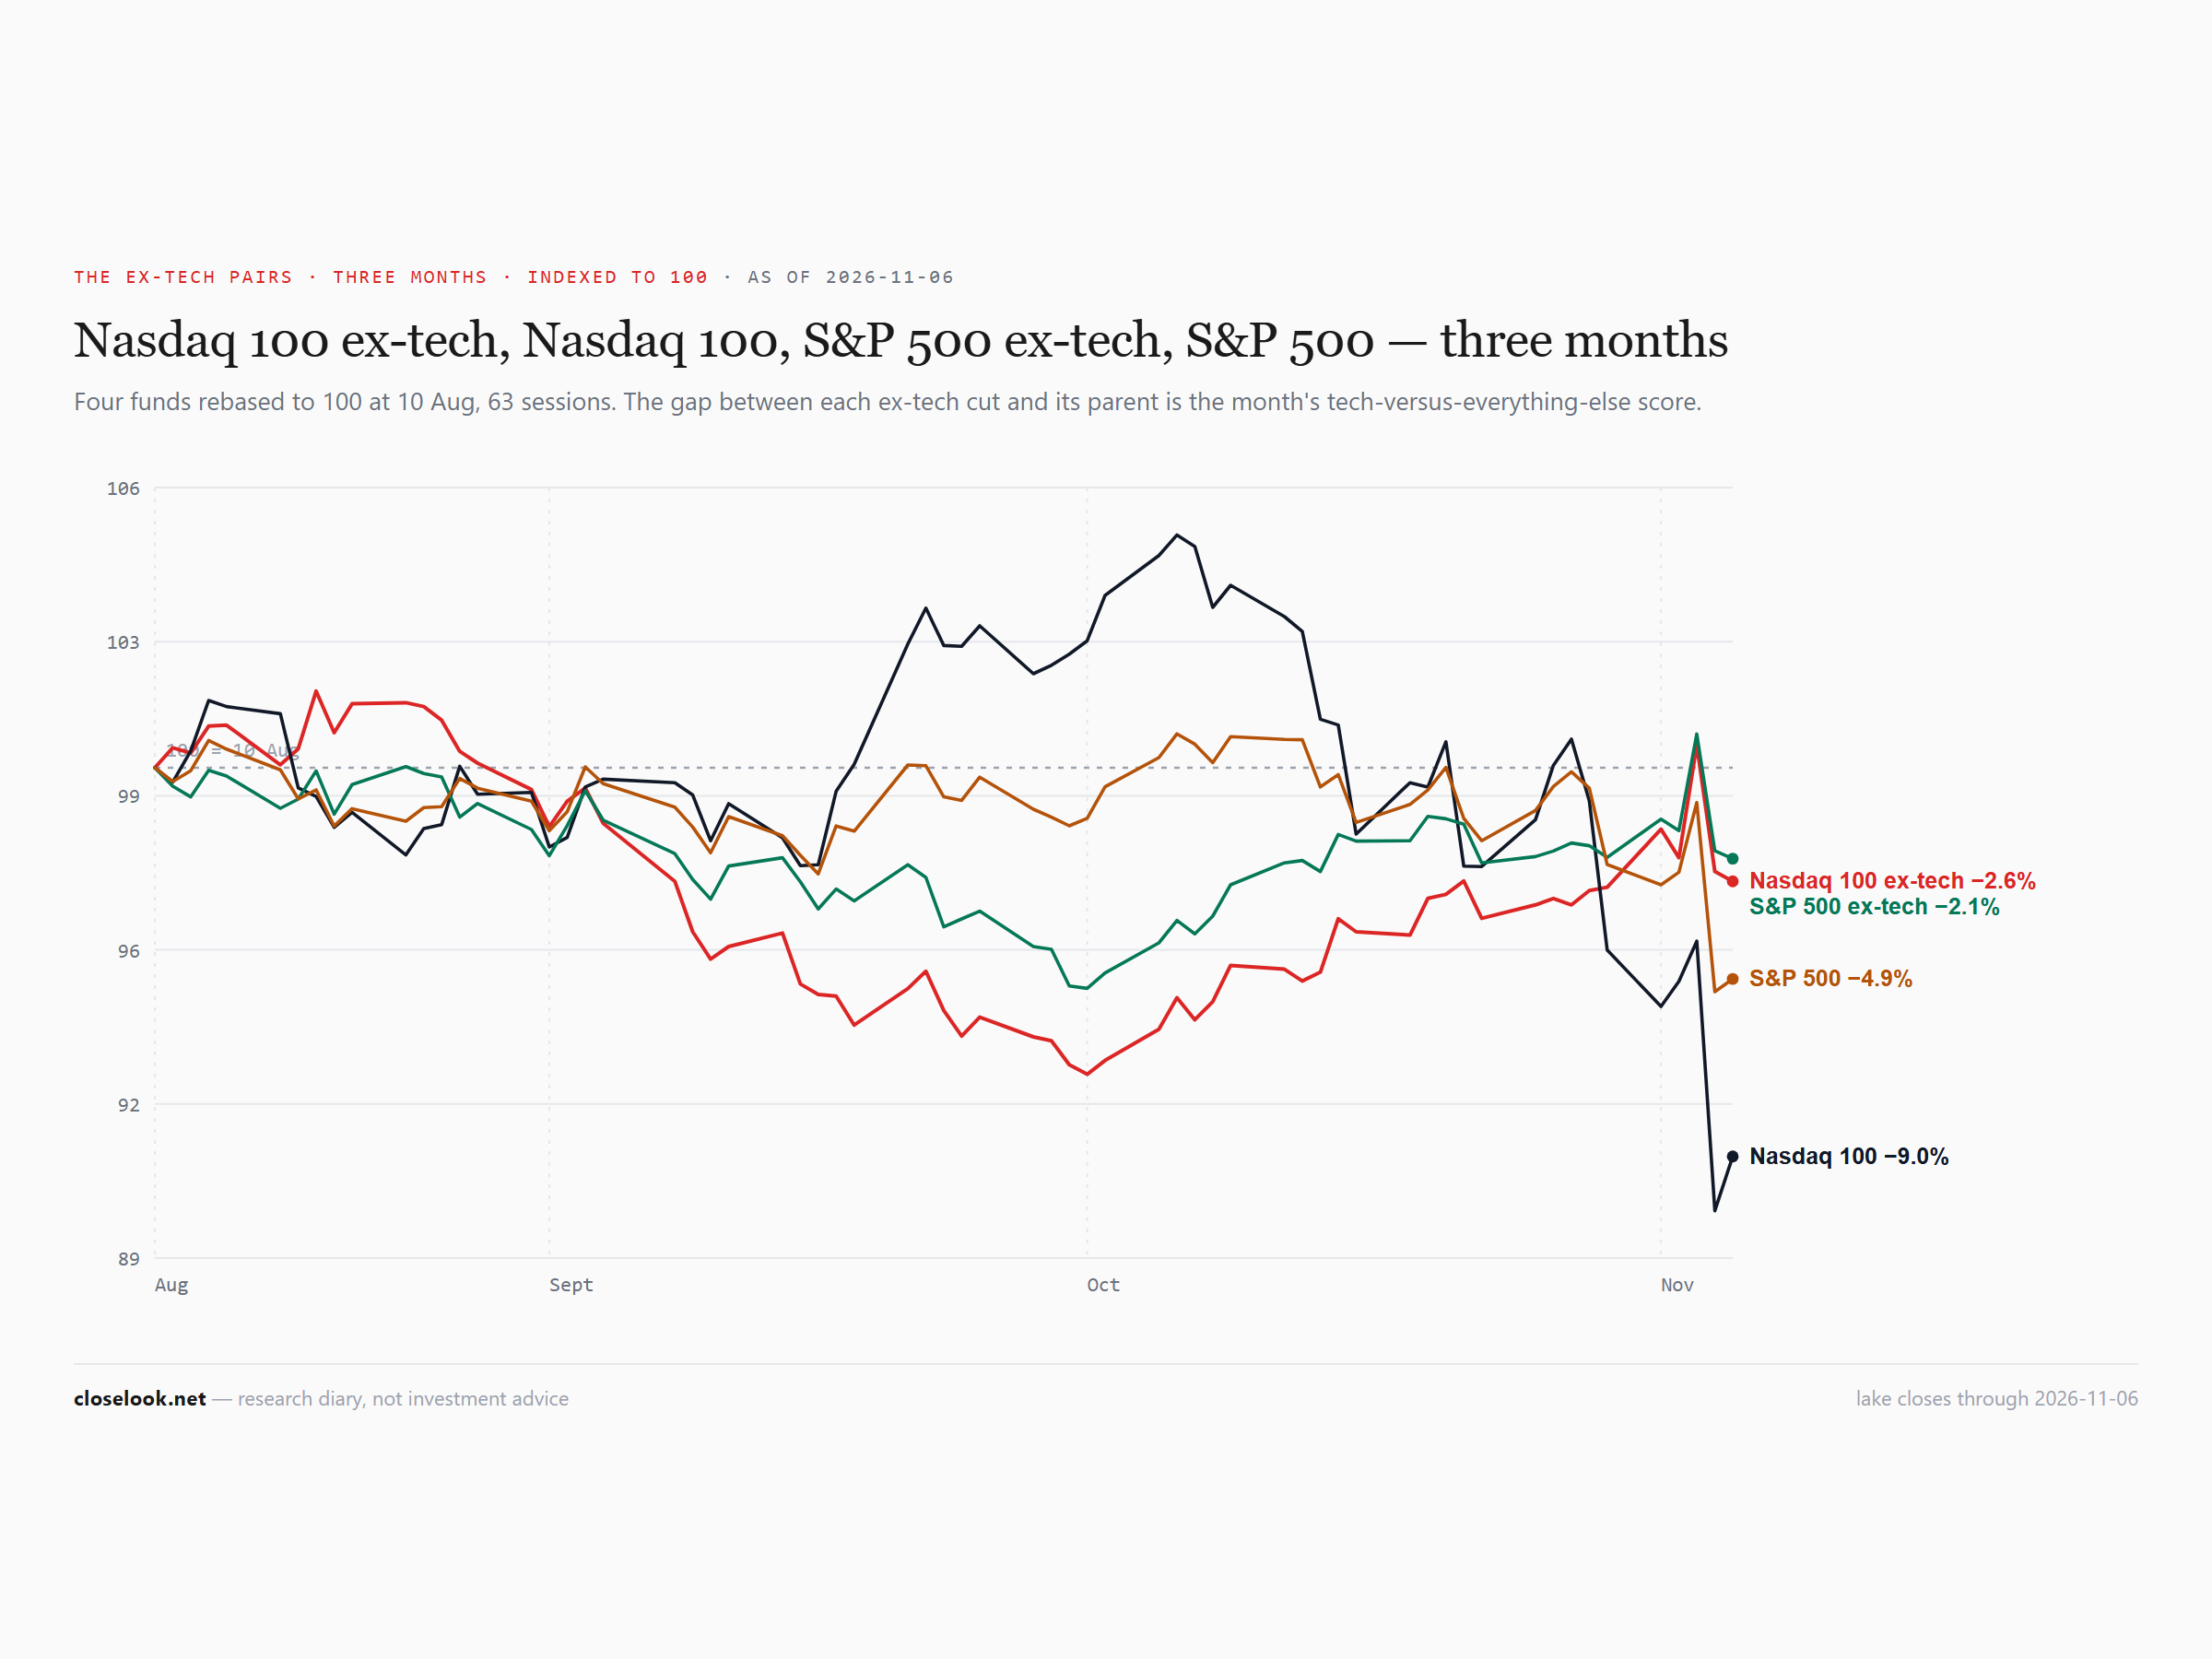
The average stock held — a fifth week ahead of the index. The equal-weight S&P fell 1.04% to 216.05, still 0.6% above its 50-day and 3.7% above its 200-day, and +12.8% on the year against +7.8% for the S&P fund. On Wednesday it closed at 223.33, its highest close of the past year. Small caps fell 2.03%. The S&P without tech was flat, −0.03%; the Nasdaq 100 without tech rose 0.14%. And the giants were not the problem: the Magnificent Seven fund fell only 1.39% to 67.53, less than the S&P, because three of its members rose — Amazon +7.9%, Alphabet +1.8%, Microsoft +1.7%. The S&P without the Seven fell 3.46%.
| Symbol | Name | Last | 5D | 1M | 3M | 6M | YTD |
|---|---|---|---|---|---|---|---|
| SLV | iShares Silver | 46.87 | +5.09% | -15.47% | -16.08% | -33.17% | -27.24% |
| GLD | Gold Shares | 372.52 | +4.71% | -2.55% | -4.40% | -13.56% | -6.00% |
| UUP | Invesco DB US Dollar Index Bul | 29.13 | +0.45% | +0.80% | +3.33% | +6.51% | +7.77% |
| IEF | iShares 7-10 Year Treasury Bon | 91.86 | +0.11% | +3.06% | -1.17% | -3.31% | -4.47% |
| TLT | iShares 20+ Year Treasury Bond | 81.92 | +0.10% | +6.00% | -0.73% | -4.83% | -6.01% |
| COPX | Global X - Copper Miners | 71.25 | -0.99% | -17.42% | -17.24% | -14.74% | -0.75% |
| IBIT | iShares Bitcoin | 42.88 | -1.11% | -11.57% | +17.51% | -7.17% | -13.64% |
| SPY | S&P 500 | 735.29 | -2.70% | -5.62% | -4.33% | +0.20% | +7.83% |
| TOPT | iShares Top 20 U.S. Stocks | 32.88 | -3.38% | -7.80% | -3.01% | -0.45% | +5.28% |
| QQQ | Invesco QQQ | 656.1 | -4.98% | -13.63% | -8.19% | -5.70% | +6.80% |
| QTOP | iShares Nasdaq Top 30 Stocks | 33.75 | -5.91% | -16.19% | -9.90% | -8.24% | +5.60% |
| USO | United States Oil LP | 148.41 | -12.10% | +2.42% | +24.85% | +10.80% | +114.59% |
Sorted by Weighted Alpha (leaders → laggards) · Barchart, close of week.
Health care and staples against tech
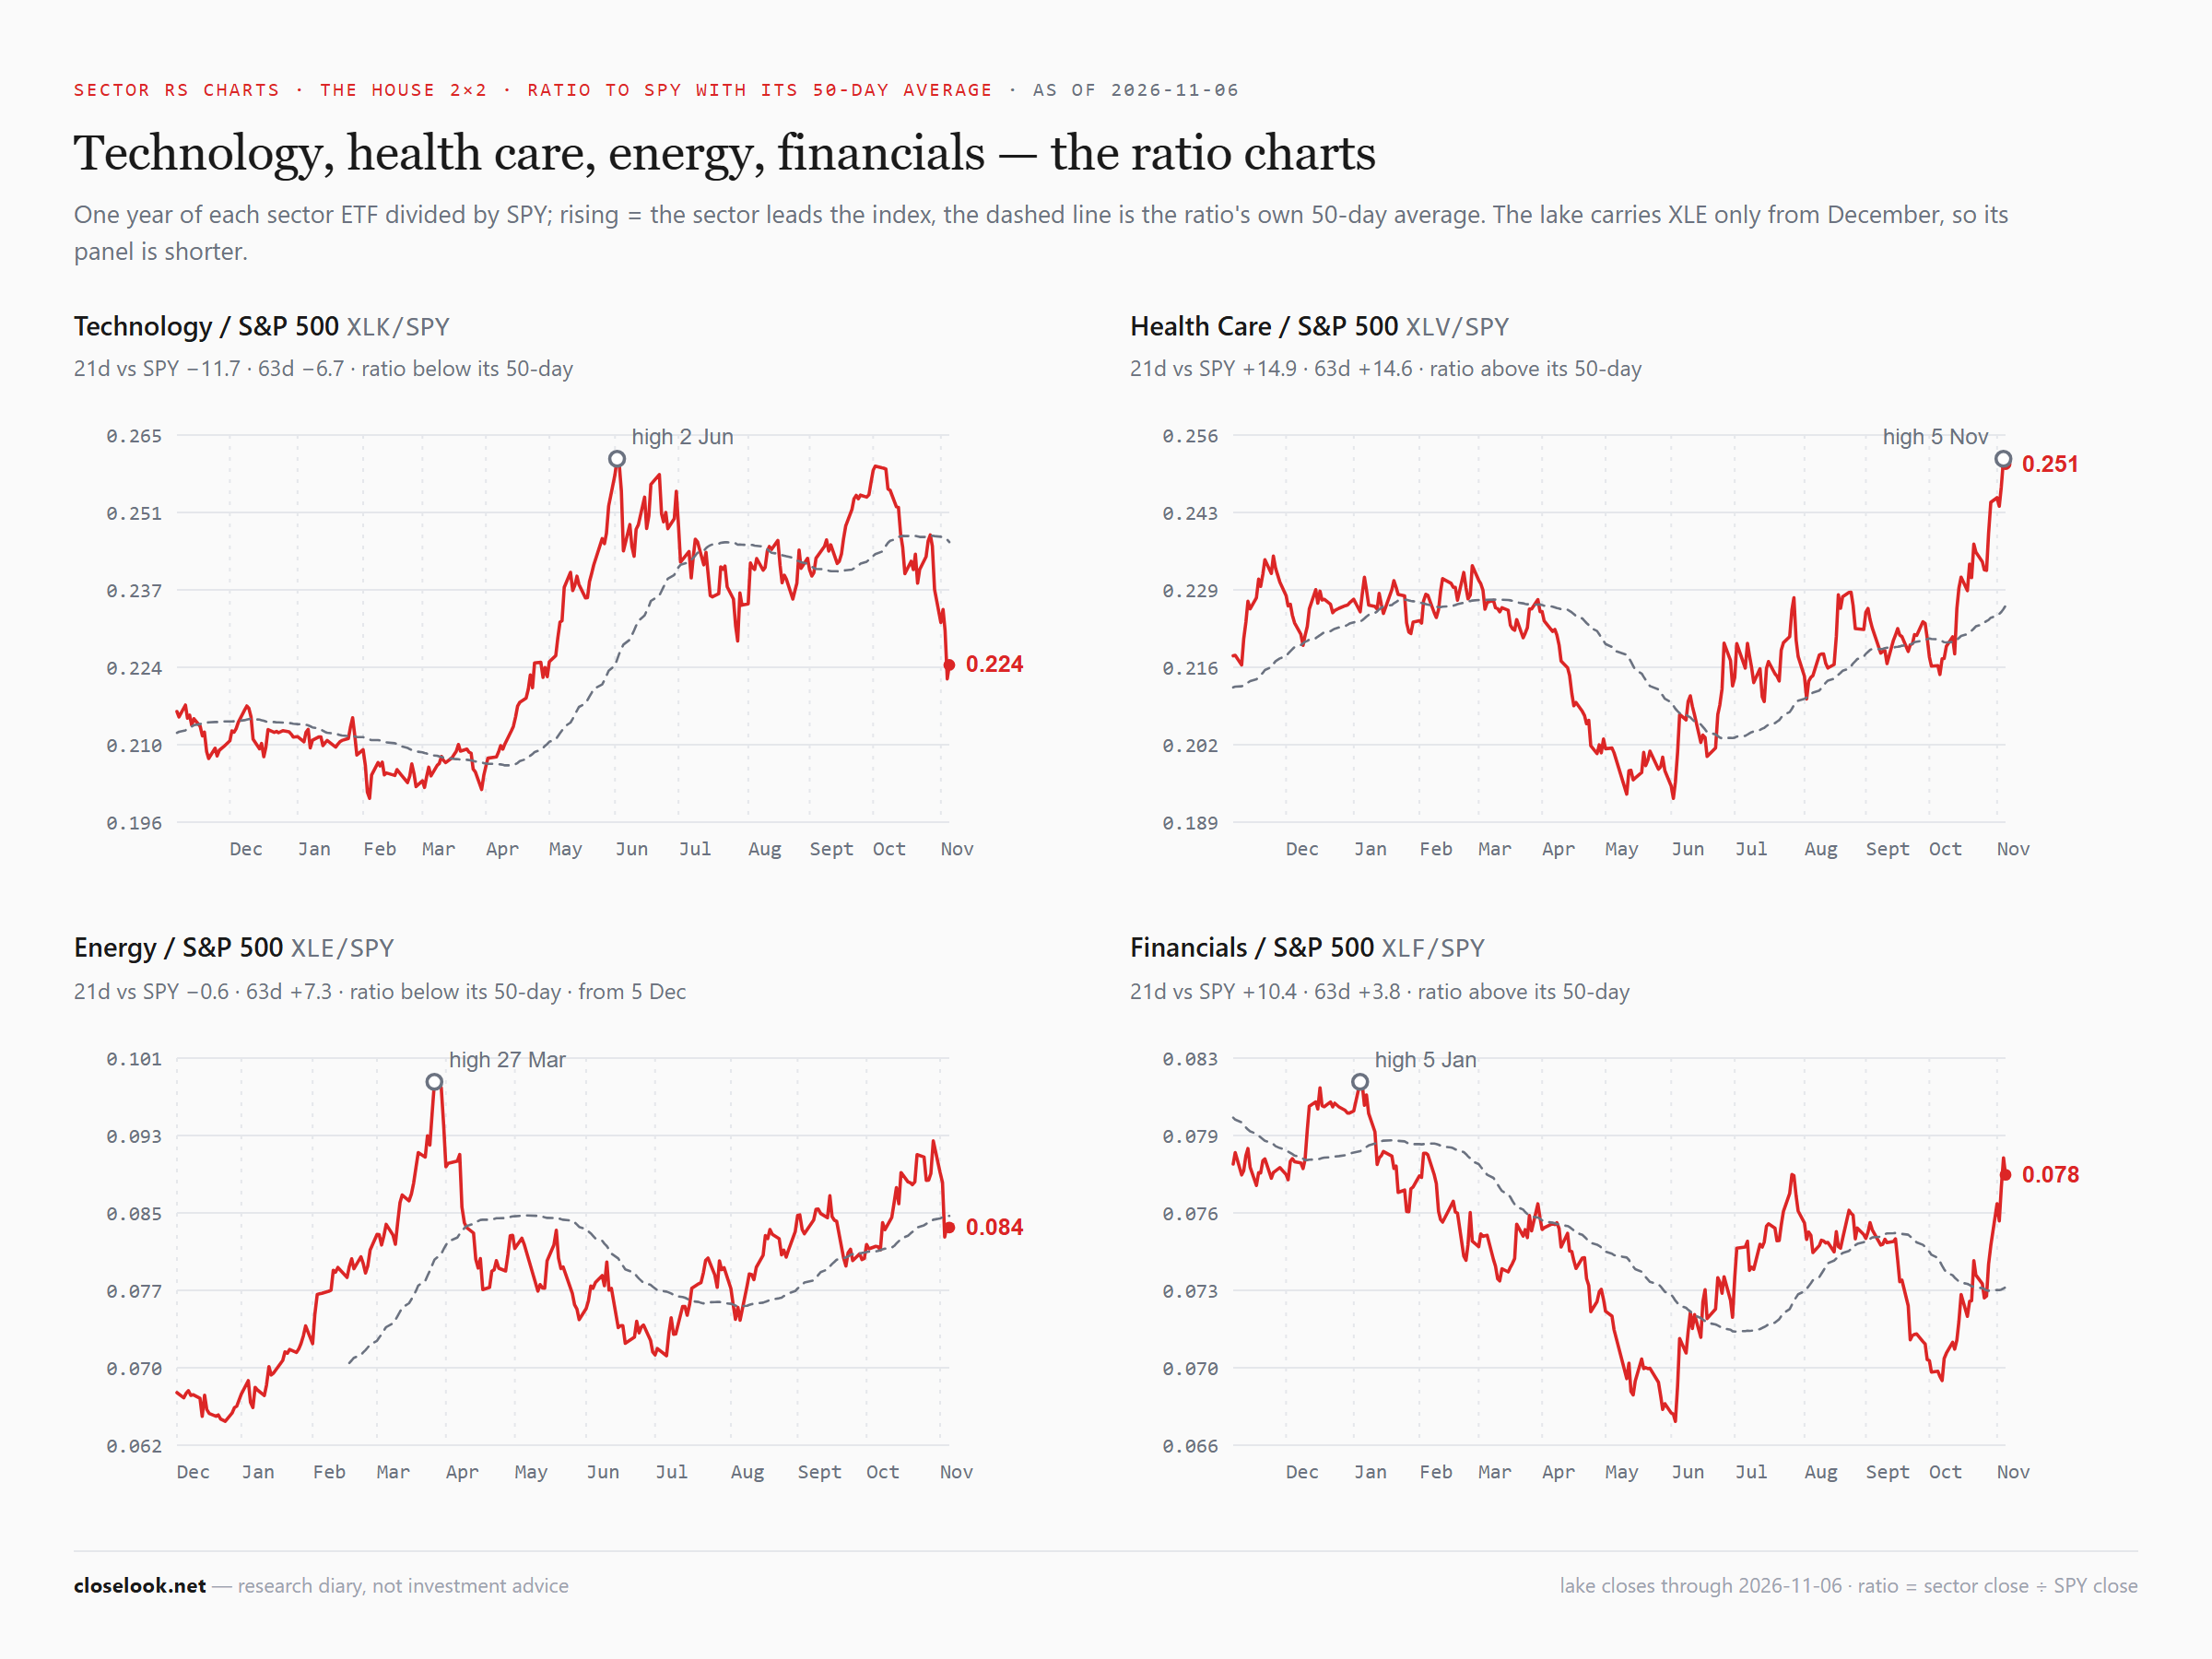
The pattern held again: when tech falls, health care and staples hold. Tech fell 8.23% to 164.74; health care closed flat, −0.04% at 184.80; staples rose 0.74% to 90.08. Over one month: health care +10.6%, staples +10.1%, tech −18.5%. The tech fund is 18.4% under its October 6 record close of 202.00.
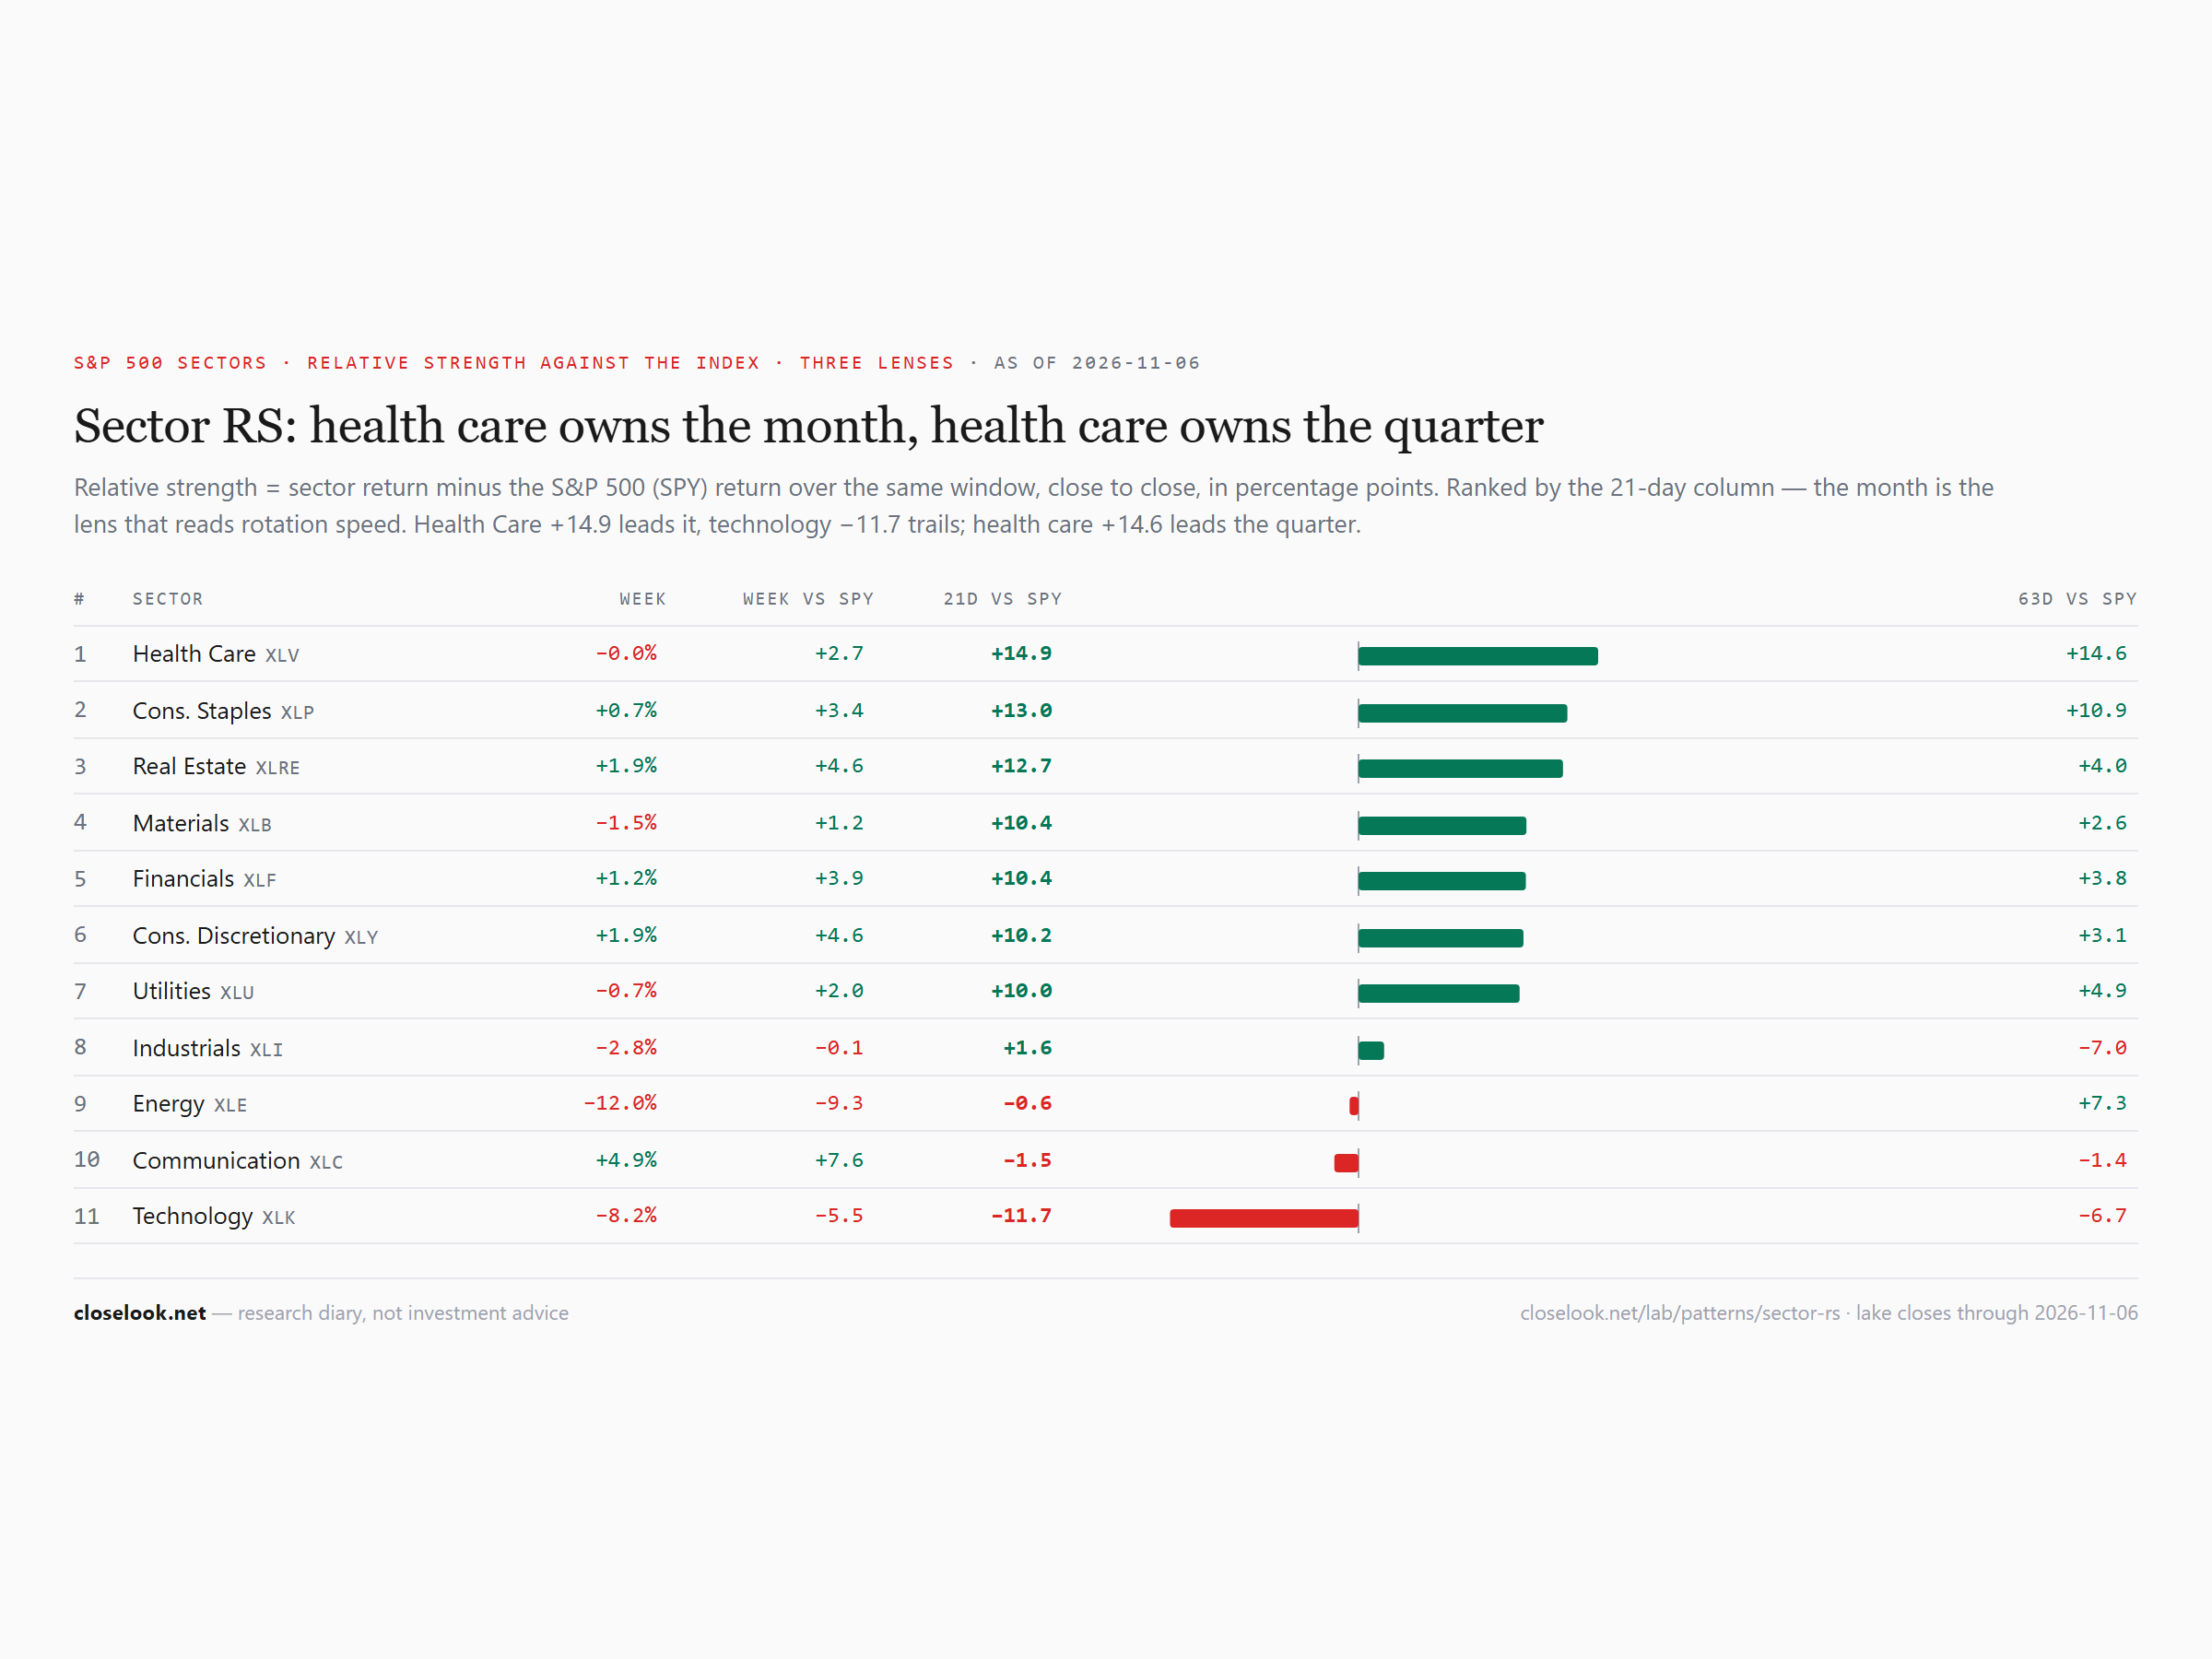
Against the S&P, the gap kept widening. Over 21 sessions health care is 14.9 points ahead of the index and staples 13.0; tech is 11.7 behind. Over 63 sessions: health care +14.6, staples +10.9, tech −6.7. A week ago health care led by 12.3 points over 21 sessions. It is a tendency, not a law — and for a second month it has been the one that paid.
The eleven S&P 500 sectors
Five of eleven up, and last week's high close of the year in energy gone in five sessions. Communication services +4.89% to 104.79, real estate +1.92%, discretionary +1.91%, financials +1.15%, staples +0.74%. The red: health care −0.04%, utilities −0.69%, materials −1.50%, industrials −2.83%, technology −8.23% and energy −12.00% to 61.62 — from 70.02 a week ago, as oil fell 12%.
| Symbol | Name | Last | 5D | 1M | 3M | 6M | YTD |
|---|---|---|---|---|---|---|---|
| XLC | Communication Services | 104.79 | +4.89% | -6.14% | -5.75% | -9.37% | -10.98% |
| XLRE | Real Estate | 44 | +1.92% | +7.06% | -1.81% | -0.38% | +9.05% |
| XLY | Consumer Discretionary | 117.58 | +1.91% | +5.25% | -0.44% | -0.42% | -1.53% |
| XLF | Financial | 57.16 | +1.15% | +5.83% | -1.12% | +10.80% | +4.36% |
| XLP | Consumer Staples | 90.08 | +0.74% | +10.12% | +5.84% | +7.16% | +15.96% |
| XLV | Health Care | 184.8 | -0.04% | +10.60% | +12.37% | +27.19% | +19.38% |
| XLU | Utilities | 43.13 | -0.69% | +4.79% | -0.58% | -6.99% | +1.03% |
| XLB | Materials | 51.95 | -1.50% | +4.46% | -0.42% | +0.82% | +14.55% |
| XLI | Industrial | 162.67 | -2.83% | -5.19% | -11.96% | -5.65% | +4.87% |
| XLK | Technology | 164.74 | -8.23% | -18.45% | -11.11% | -3.11% | +14.43% |
| XLE | Energy | 61.62 | -12.00% | -3.34% | +5.95% | +3.65% | +37.82% |
Sorted by Weighted Alpha (leaders → laggards) · Barchart, close of week.
Against the S&P. On the week: communication +7.6 points, discretionary and real estate +4.6, financials +3.9, staples +3.4, health care +2.7; tech −5.5, energy −9.3. Over 21 sessions: health care +14.9, staples +13.0, real estate +12.7, materials and financials +10.4, discretionary +10.2, utilities +10.0 — tech −11.7. Seven sectors are ten points or more ahead of the index over a month. One is almost twelve behind.
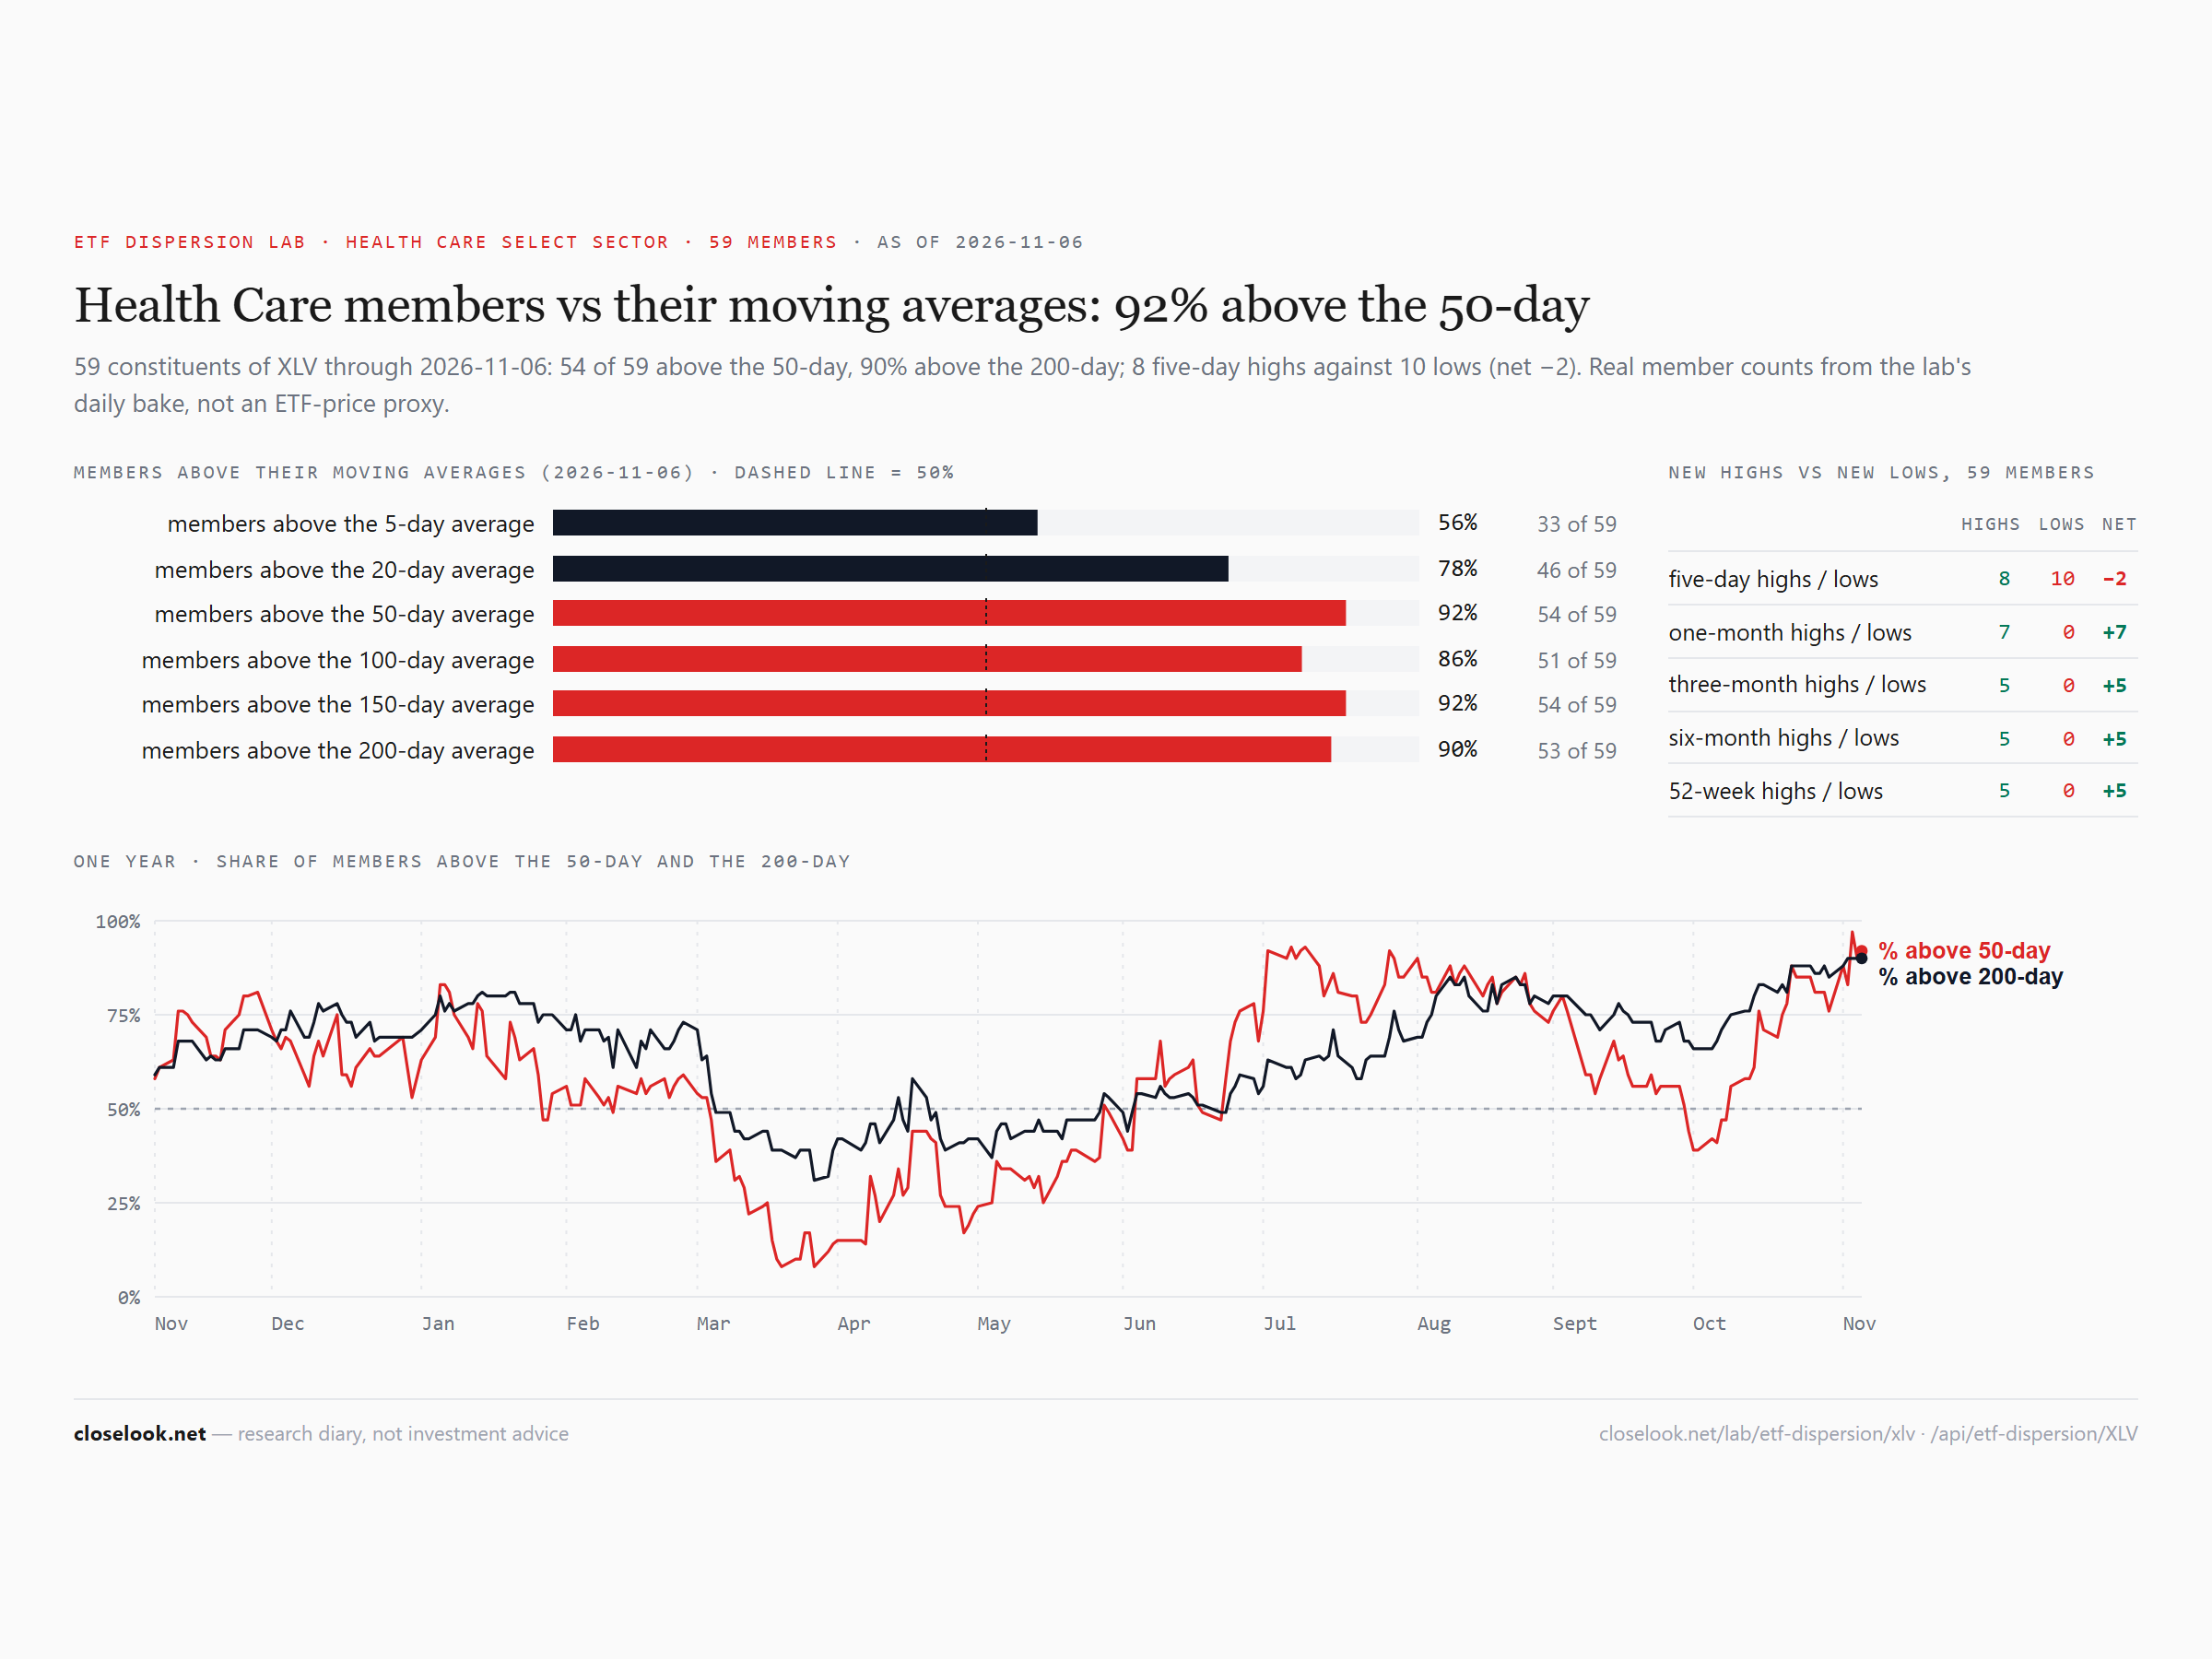
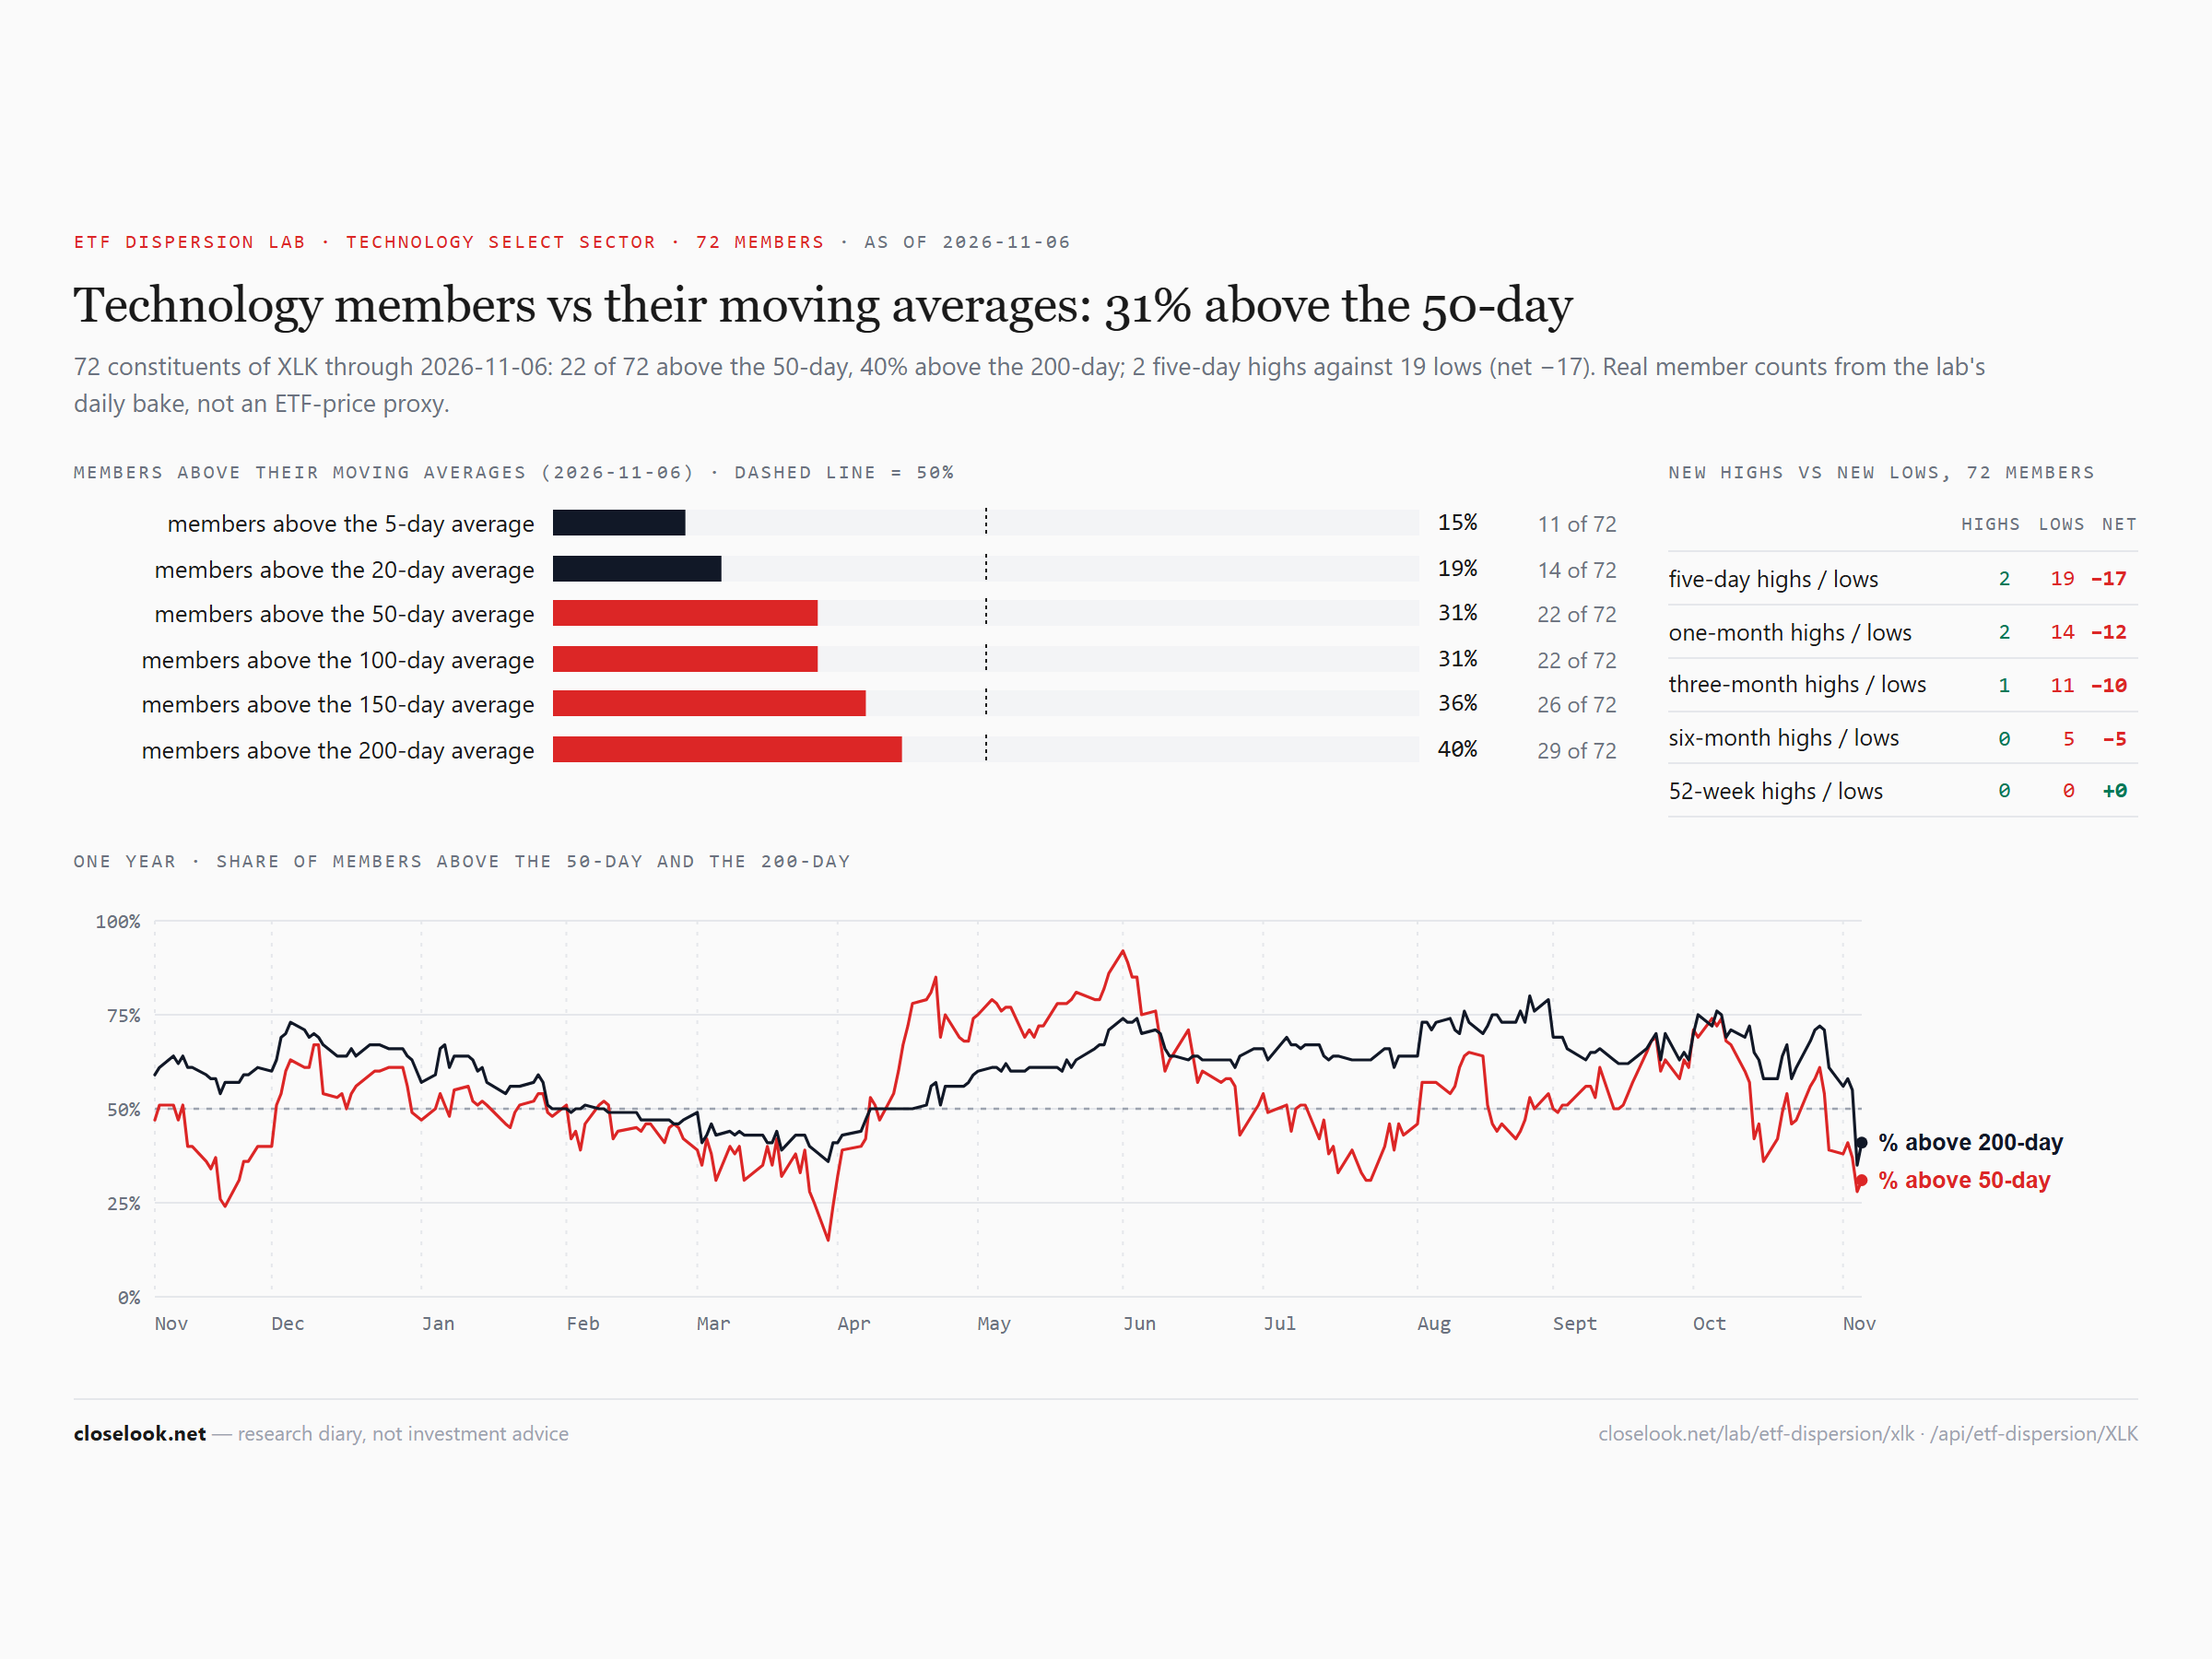
Breadth — health care broad, tech thin, energy empty. In health care 54 of 59 members closed above their 50-day average and 46 above the 20-day. In tech 22 of 72 are above the 50-day, 14 above the 20-day and 11 above the 5-day; 19 made a five-day low. In energy none of 21 members is above its 20-day or its 50-day. Financials sit in between: 46 of 76 above the 50-day.
The Nasdaq 100, cut six ways
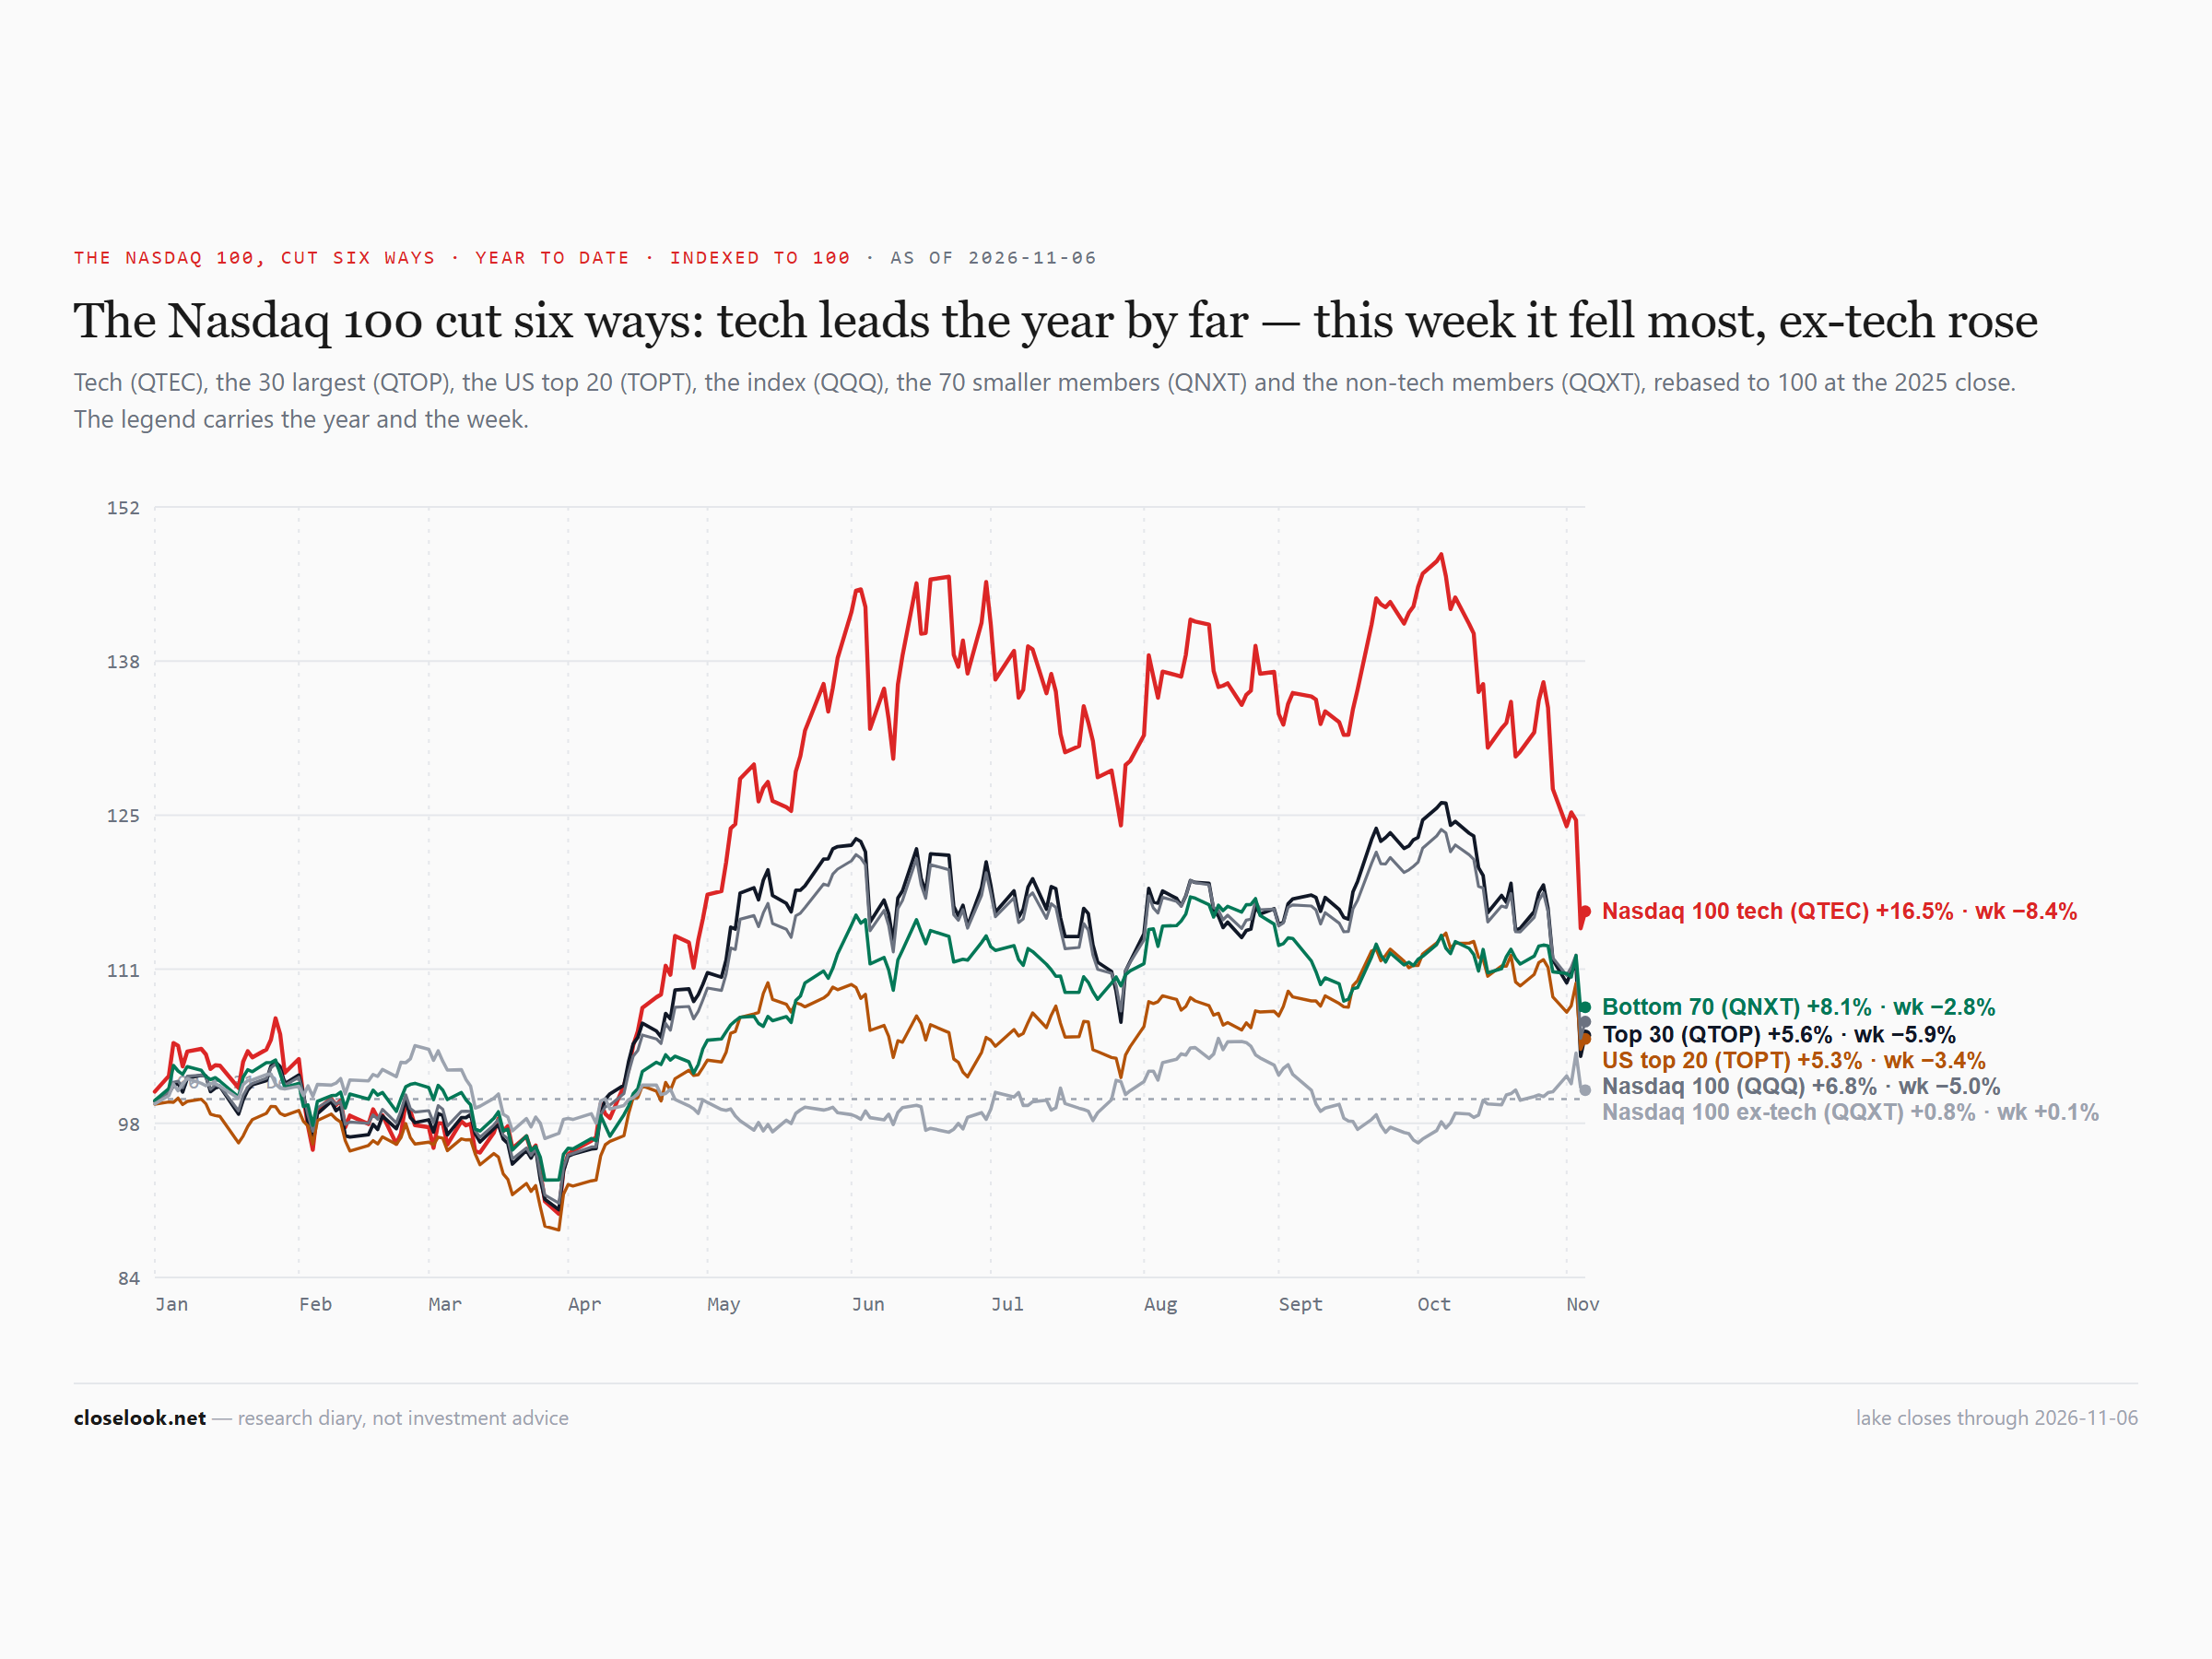
The week: the Nasdaq 100 without tech +0.14%, the US top-20 fund −3.38%, the equal-weight Nasdaq 100 −3.68%, the Nasdaq 100 fund −4.98%, its 30 largest −5.91%, Nasdaq tech −8.44%. On the year: tech +16.5%, equal weight +9.5%, the index +6.8%, the 30 largest +5.6%, the top 20 +5.3%, ex-tech +0.8%. A week ago Nasdaq tech was up 27.2% for 2026. One week took more than a third of that away.
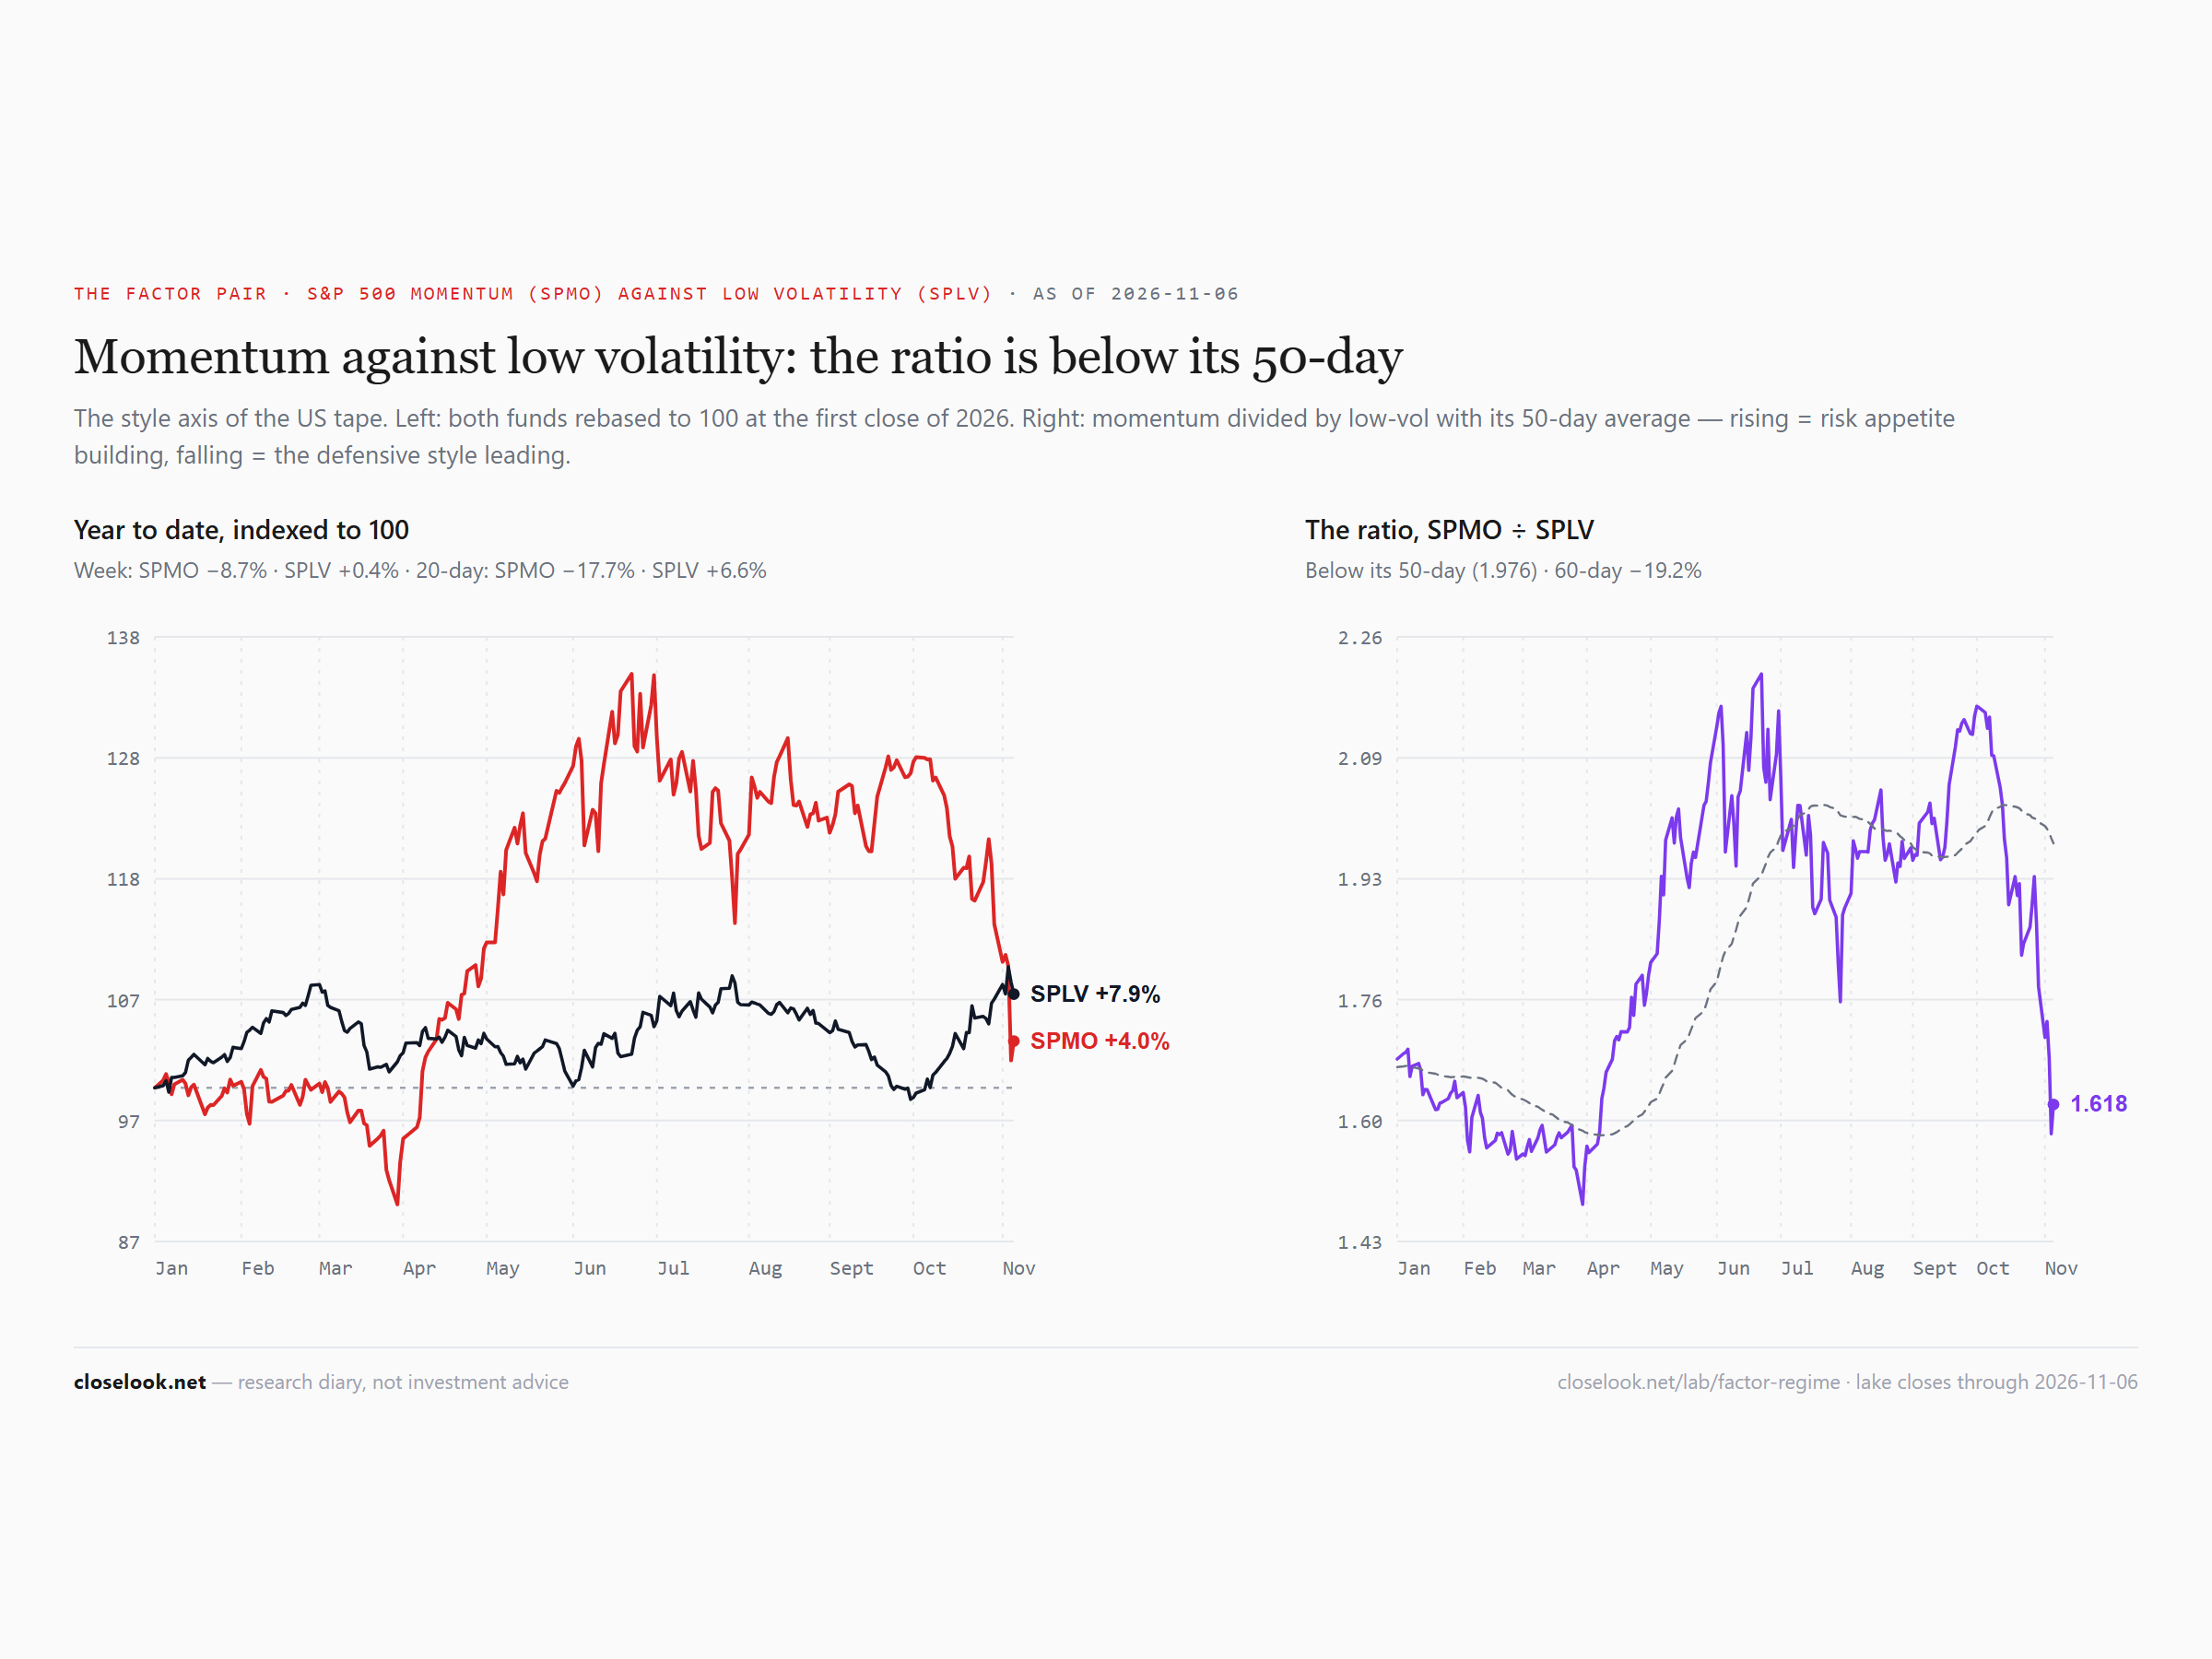
Momentum against low volatility — a fourth week of defence. Momentum fell 8.70%, low volatility rose 0.39%. The ratio fell from 141.3 to 128.5 indexed, against a trend line at 156.9, and the factor board reads below trend — a defensive rotation, low volatility leading.
The tech ETFs we carry
Three of twenty-one green. The chips and the AI baskets led the fall: the WisdomTree AI fund −13.09%, SMH −11.20%, cybersecurity −9.89%, the fabless fund −9.37%, XSD −8.01%, quantum −7.82%, cloud −7.74%. The green: video games +6.32%, lithium and batteries +1.84%, fintech +1.32%.
| Symbol | Name | Last | 5D | 1M | 3M | 6M | YTD |
|---|---|---|---|---|---|---|---|
| ESPO | VanEck Video Gaming and eSport | 102.27 | +6.32% | +4.74% | +6.20% | +11.60% | -1.29% |
| LIT | Global X - Lithium & Battery T | 60.91 | +1.84% | -14.30% | -15.88% | -33.45% | -6.09% |
| FINX | Global X - FinTech | 24.2 | +1.32% | -2.56% | -7.18% | -7.02% | -17.76% |
| FDN | First Dow Jones Internet Index | 260.58 | -2.12% | -12.20% | -8.07% | -2.35% | -3.19% |
| DTCR | Global X - Data Center & Digit | 24.87 | -2.74% | -10.48% | -11.12% | -17.95% | +17.87% |
| NLR | VanEck Uranium and Nuclear | 88.44 | -3.61% | -19.18% | -22.33% | -40.74% | -28.79% |
| BOTZ | Global X - Robotics & Artifici | 31.05 | -3.63% | -14.16% | -15.94% | -22.14% | -14.30% |
| DAPP | VanEck Digital Transformation | 13.63 | -3.81% | -28.45% | -21.80% | -38.63% | -17.54% |
| IGV | iShares Expanded Tech-Software | 98.88 | -5.19% | -11.05% | -0.54% | +12.59% | -6.44% |
| AIQ | Global X - Artificial Intellig | 56.89 | -5.40% | -15.15% | -8.17% | -5.66% | +11.86% |
| SNSR | Global X - Internet of Things | 43.96 | -5.54% | -12.70% | -9.12% | -5.60% | +18.95% |
| GRID | First NASDAQ Clean Edge Smart | 154.21 | -6.26% | -16.33% | -16.91% | -22.01% | +0.78% |
| ARKK | ARK Innovation | 75.46 | -6.55% | -16.61% | -0.36% | -5.18% | -1.90% |
| CLOU | Global X - Cloud Computing | 25.85 | -7.74% | -11.05% | -1.56% | +15.76% | +14.28% |
| QTUM | Defiance Quantum | 123.37 | -7.82% | -21.62% | -17.33% | -14.12% | +12.50% |
| XSD | S&P Semiconductor | 415.88 | -8.01% | -25.53% | -20.09% | -21.82% | +29.32% |
| SHLD | Global X - Defense Tech | 58.2 | -8.75% | -3.10% | -14.13% | -14.36% | -10.17% |
| SMHX | VanEck Fabless Semiconductor | 46.9 | -9.37% | -27.60% | -20.19% | -13.91% | +23.32% |
| CIBR | First Nasdaq Cybersecurity | 91.04 | -9.89% | -15.81% | -5.55% | +29.74% | +27.42% |
| SMH | VanEck Semiconductor | 463.96 | -11.20% | -26.65% | -18.81% | -15.61% | +28.83% |
| WTAI | WisdomTree Artificial Intellig | 31.53 | -13.09% | -30.86% | -22.42% | -20.34% | +8.20% |
Sorted by Weighted Alpha (leaders → laggards) · Barchart, close of week.
Software — under 100, but ahead of the chips. IGV closed at 98.88, down 5.19%, under the round 100 and 7.3% under its 50-day of 106.71 — still 5.1% above its 200-day. The software-to-chips ratio rose 6.8% on the week to 0.2131, 63% above its June low: software fell, the chips fell twice as far. The cloud fund closed at 25.85, 15.6% under the 2026 high it made on 26 October; cybersecurity at 91.04, 10.1% under its 50-day. In the names: Datadog −23.9%, Atlassian −19.8%, Okta −19.0%, Zscaler −16.9%, CrowdStrike −13.4% — and, gentler, Salesforce −6.8%, Adobe −4.4%, ServiceNow −3.0%.
The names in one line each. Up: Stryker +11.7%, Booking +8.5%, United Airlines +8.2%, Amazon +7.9% to 259.30, Royal Caribbean +6.5%, Tempus AI +5.3%, Alphabet +1.8%, Microsoft +1.7%. Down: Lumentum −35.9%, Marvell −28.1%, Western Digital −28.0%, Applied Optoelectronics −27.4%, Astera Labs −26.3%, Dell −22.6%, Micron −22.0% to 690.00, Nvidia −8.8% to 186.64.
The four indices
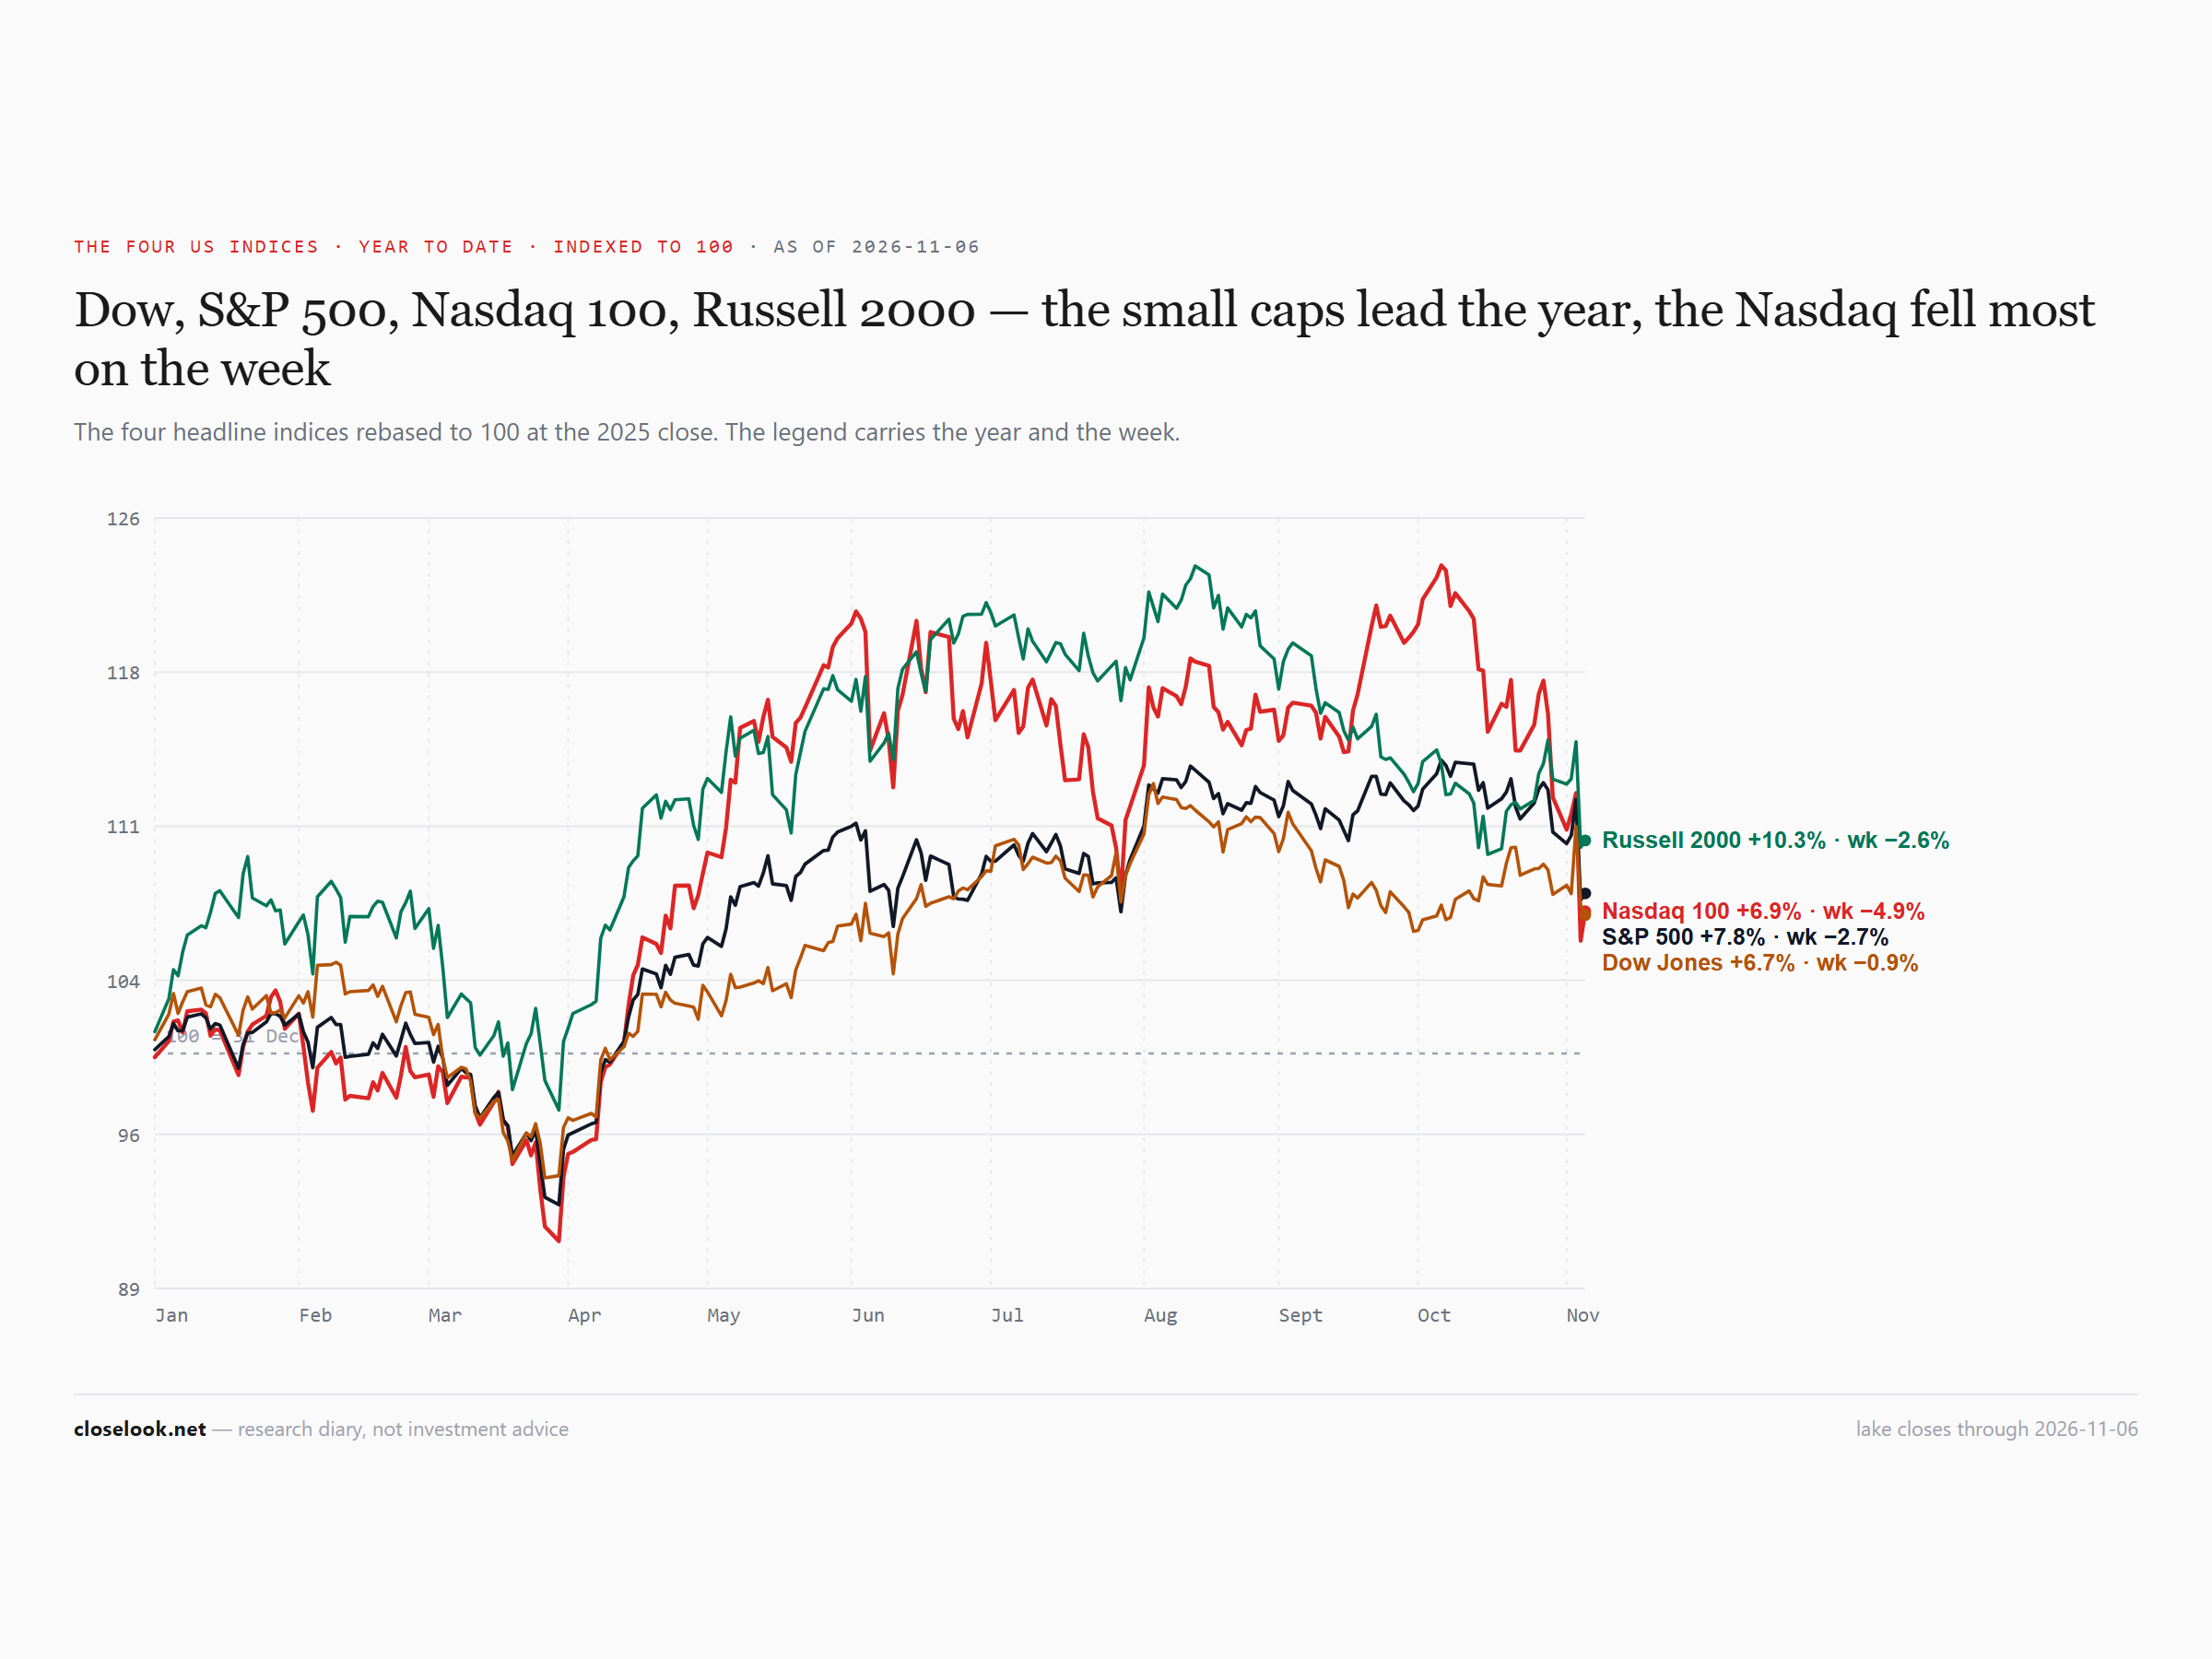
The S&P 500 −2.68% to 7,377, the Russell 2000 −2.62% to 2,738, the Nasdaq 100 −4.91% to 26,990. The Dow fell 0.94% to 51,286, after rising 2.3% on Wednesday alone, the day the election results came in. On the year, by the funds: small caps +11.2%, the S&P +7.8%, the Nasdaq 100 +6.8%. A week ago the Nasdaq 100 led the S&P for 2026; it now trails it.
The Treasury curve
The ten-year closed at 4.87% on the house sovereign board, from 4.93% — a second weekly close under 5%. The thirty-year closed at 5.27%, the two-year at 4.52%. The long bond rose 0.10% to 81.92, a third week above its 81.2 line; the 7–10-year fund rose 0.11% to 91.86.
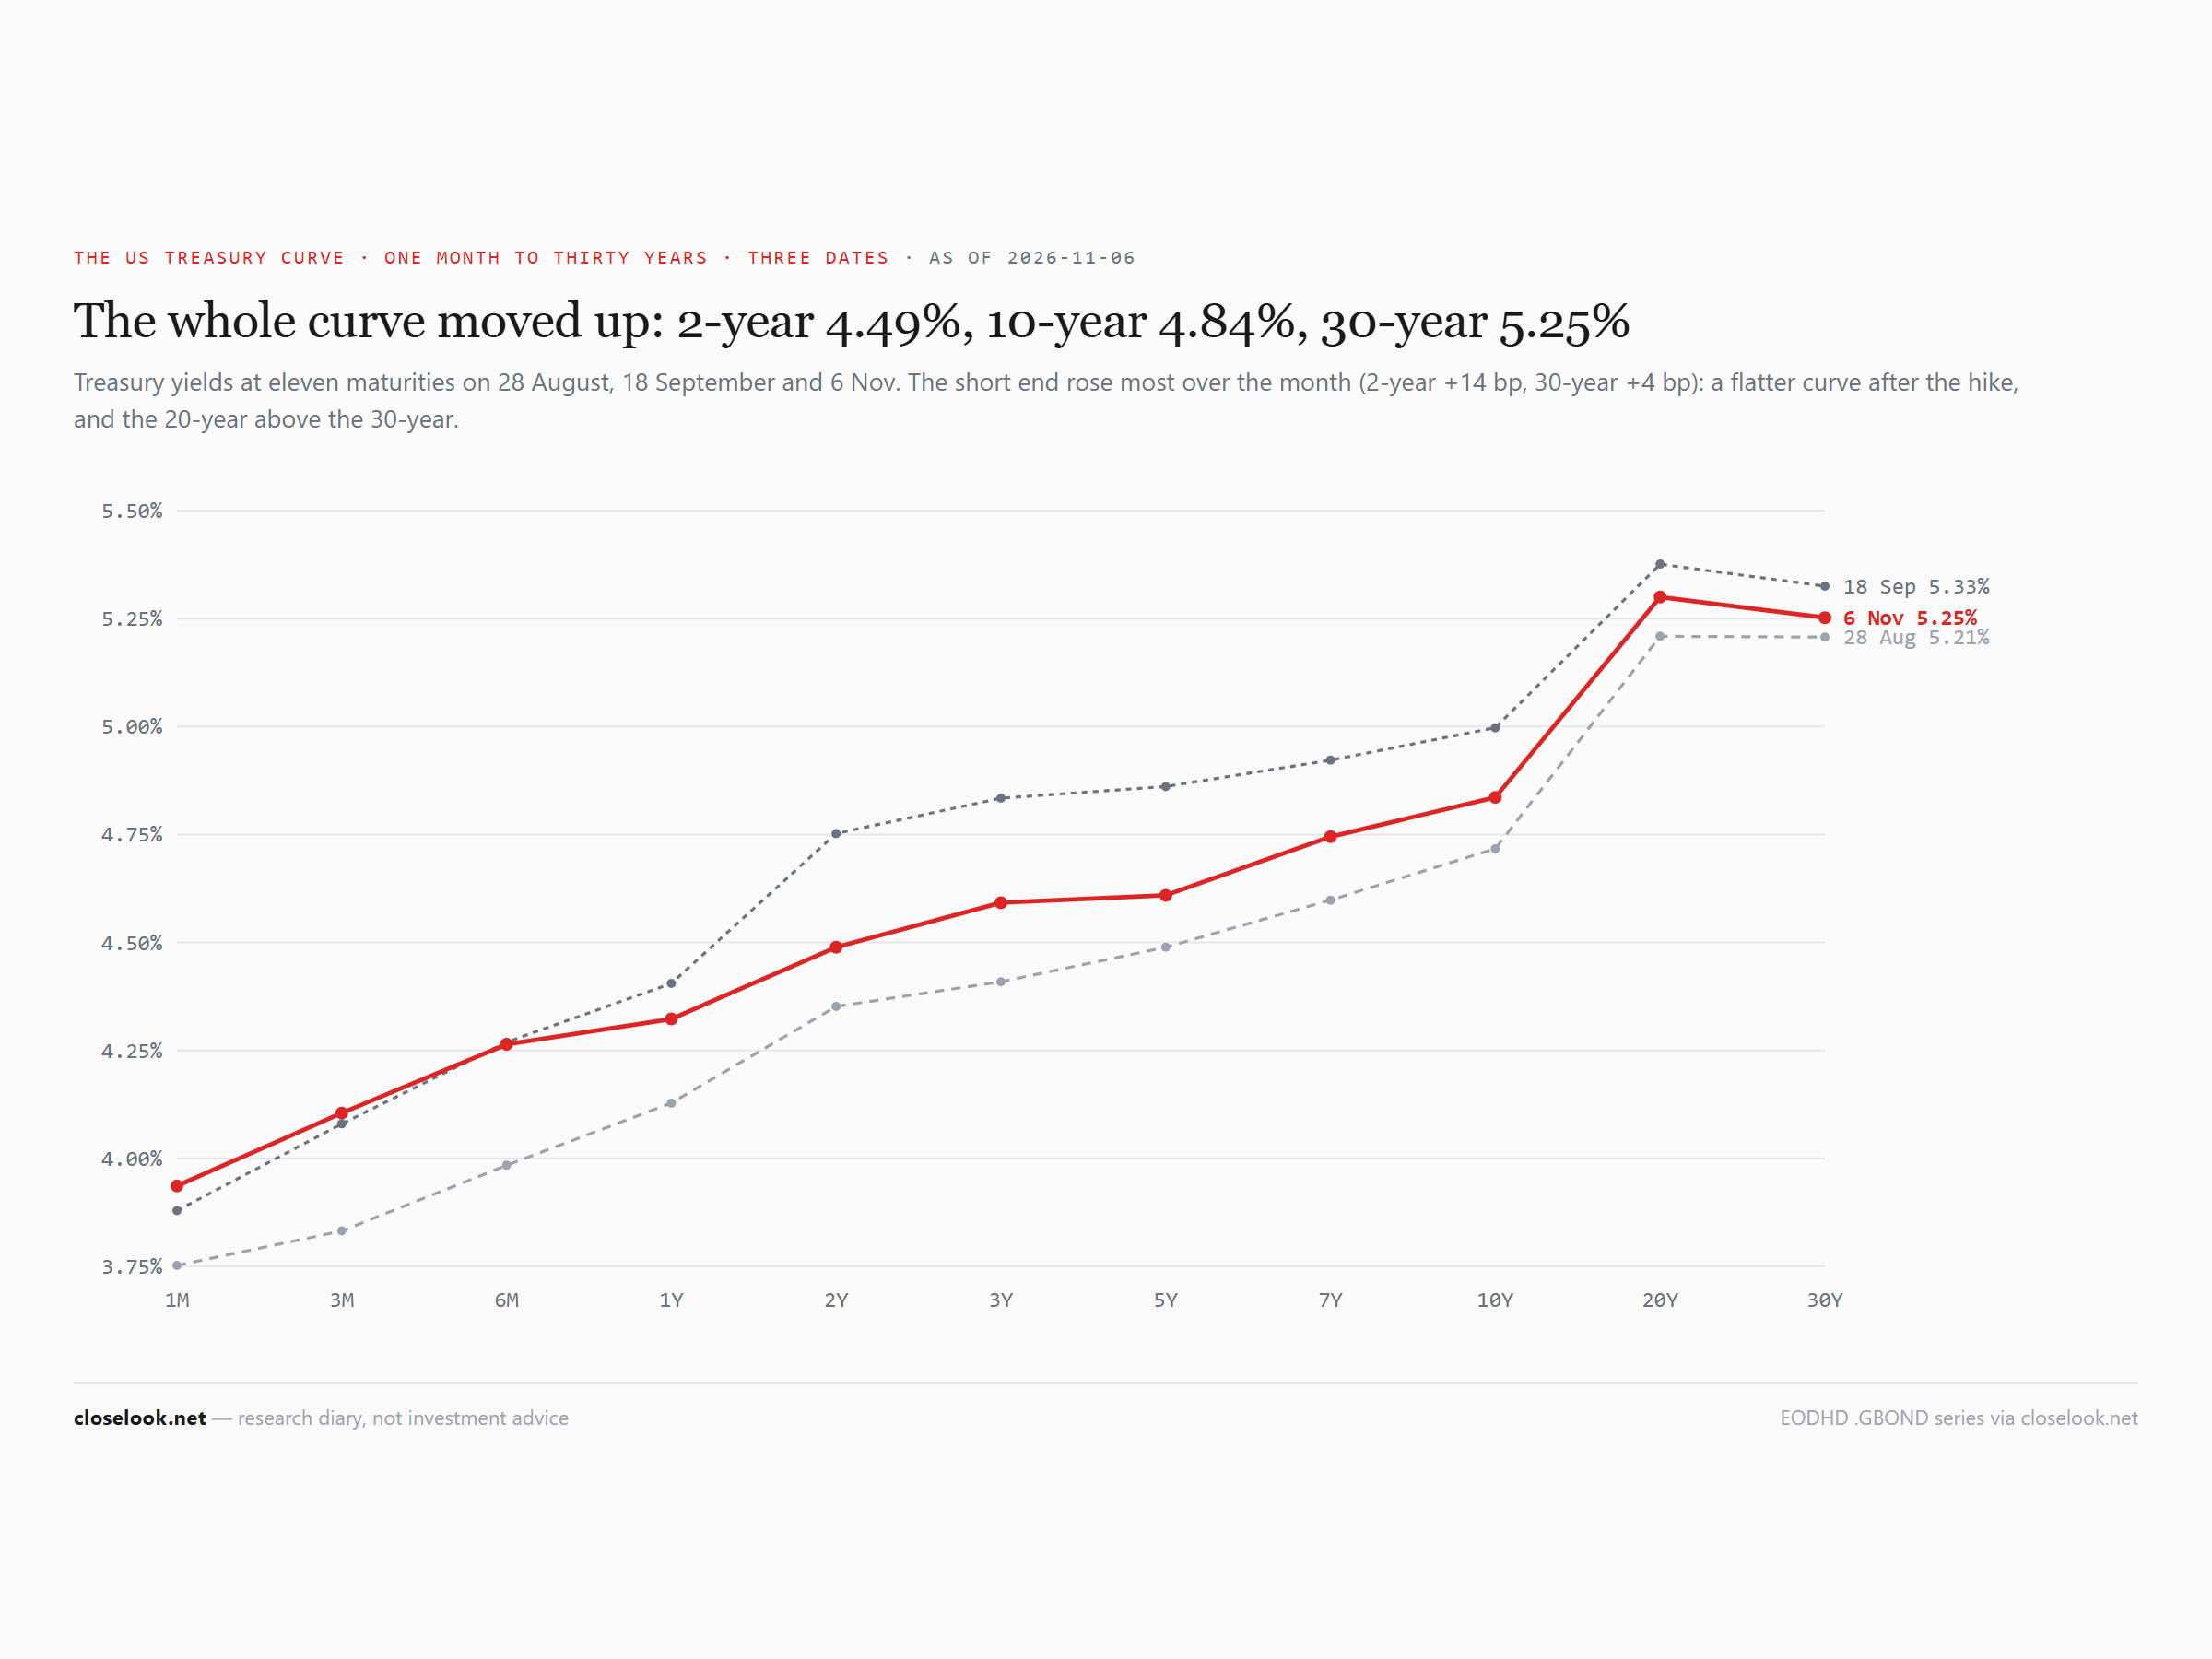
A strong jobs report, and a lower ten-year. Friday's report showed 165,000 new jobs in October against about 60,000 expected, with unemployment at 4.1%. The Fed, under Chair Kevin Warsh, held its range at 3.75–4.00% on 28 October and decides next on 9 December, with new projections; on 29 October, before Friday's report, the futures put a December hike near 80%. The ten-year fell anyway. In a week when the chip index lost 12% in one session, the bond market looked past a strong report.
The dollar
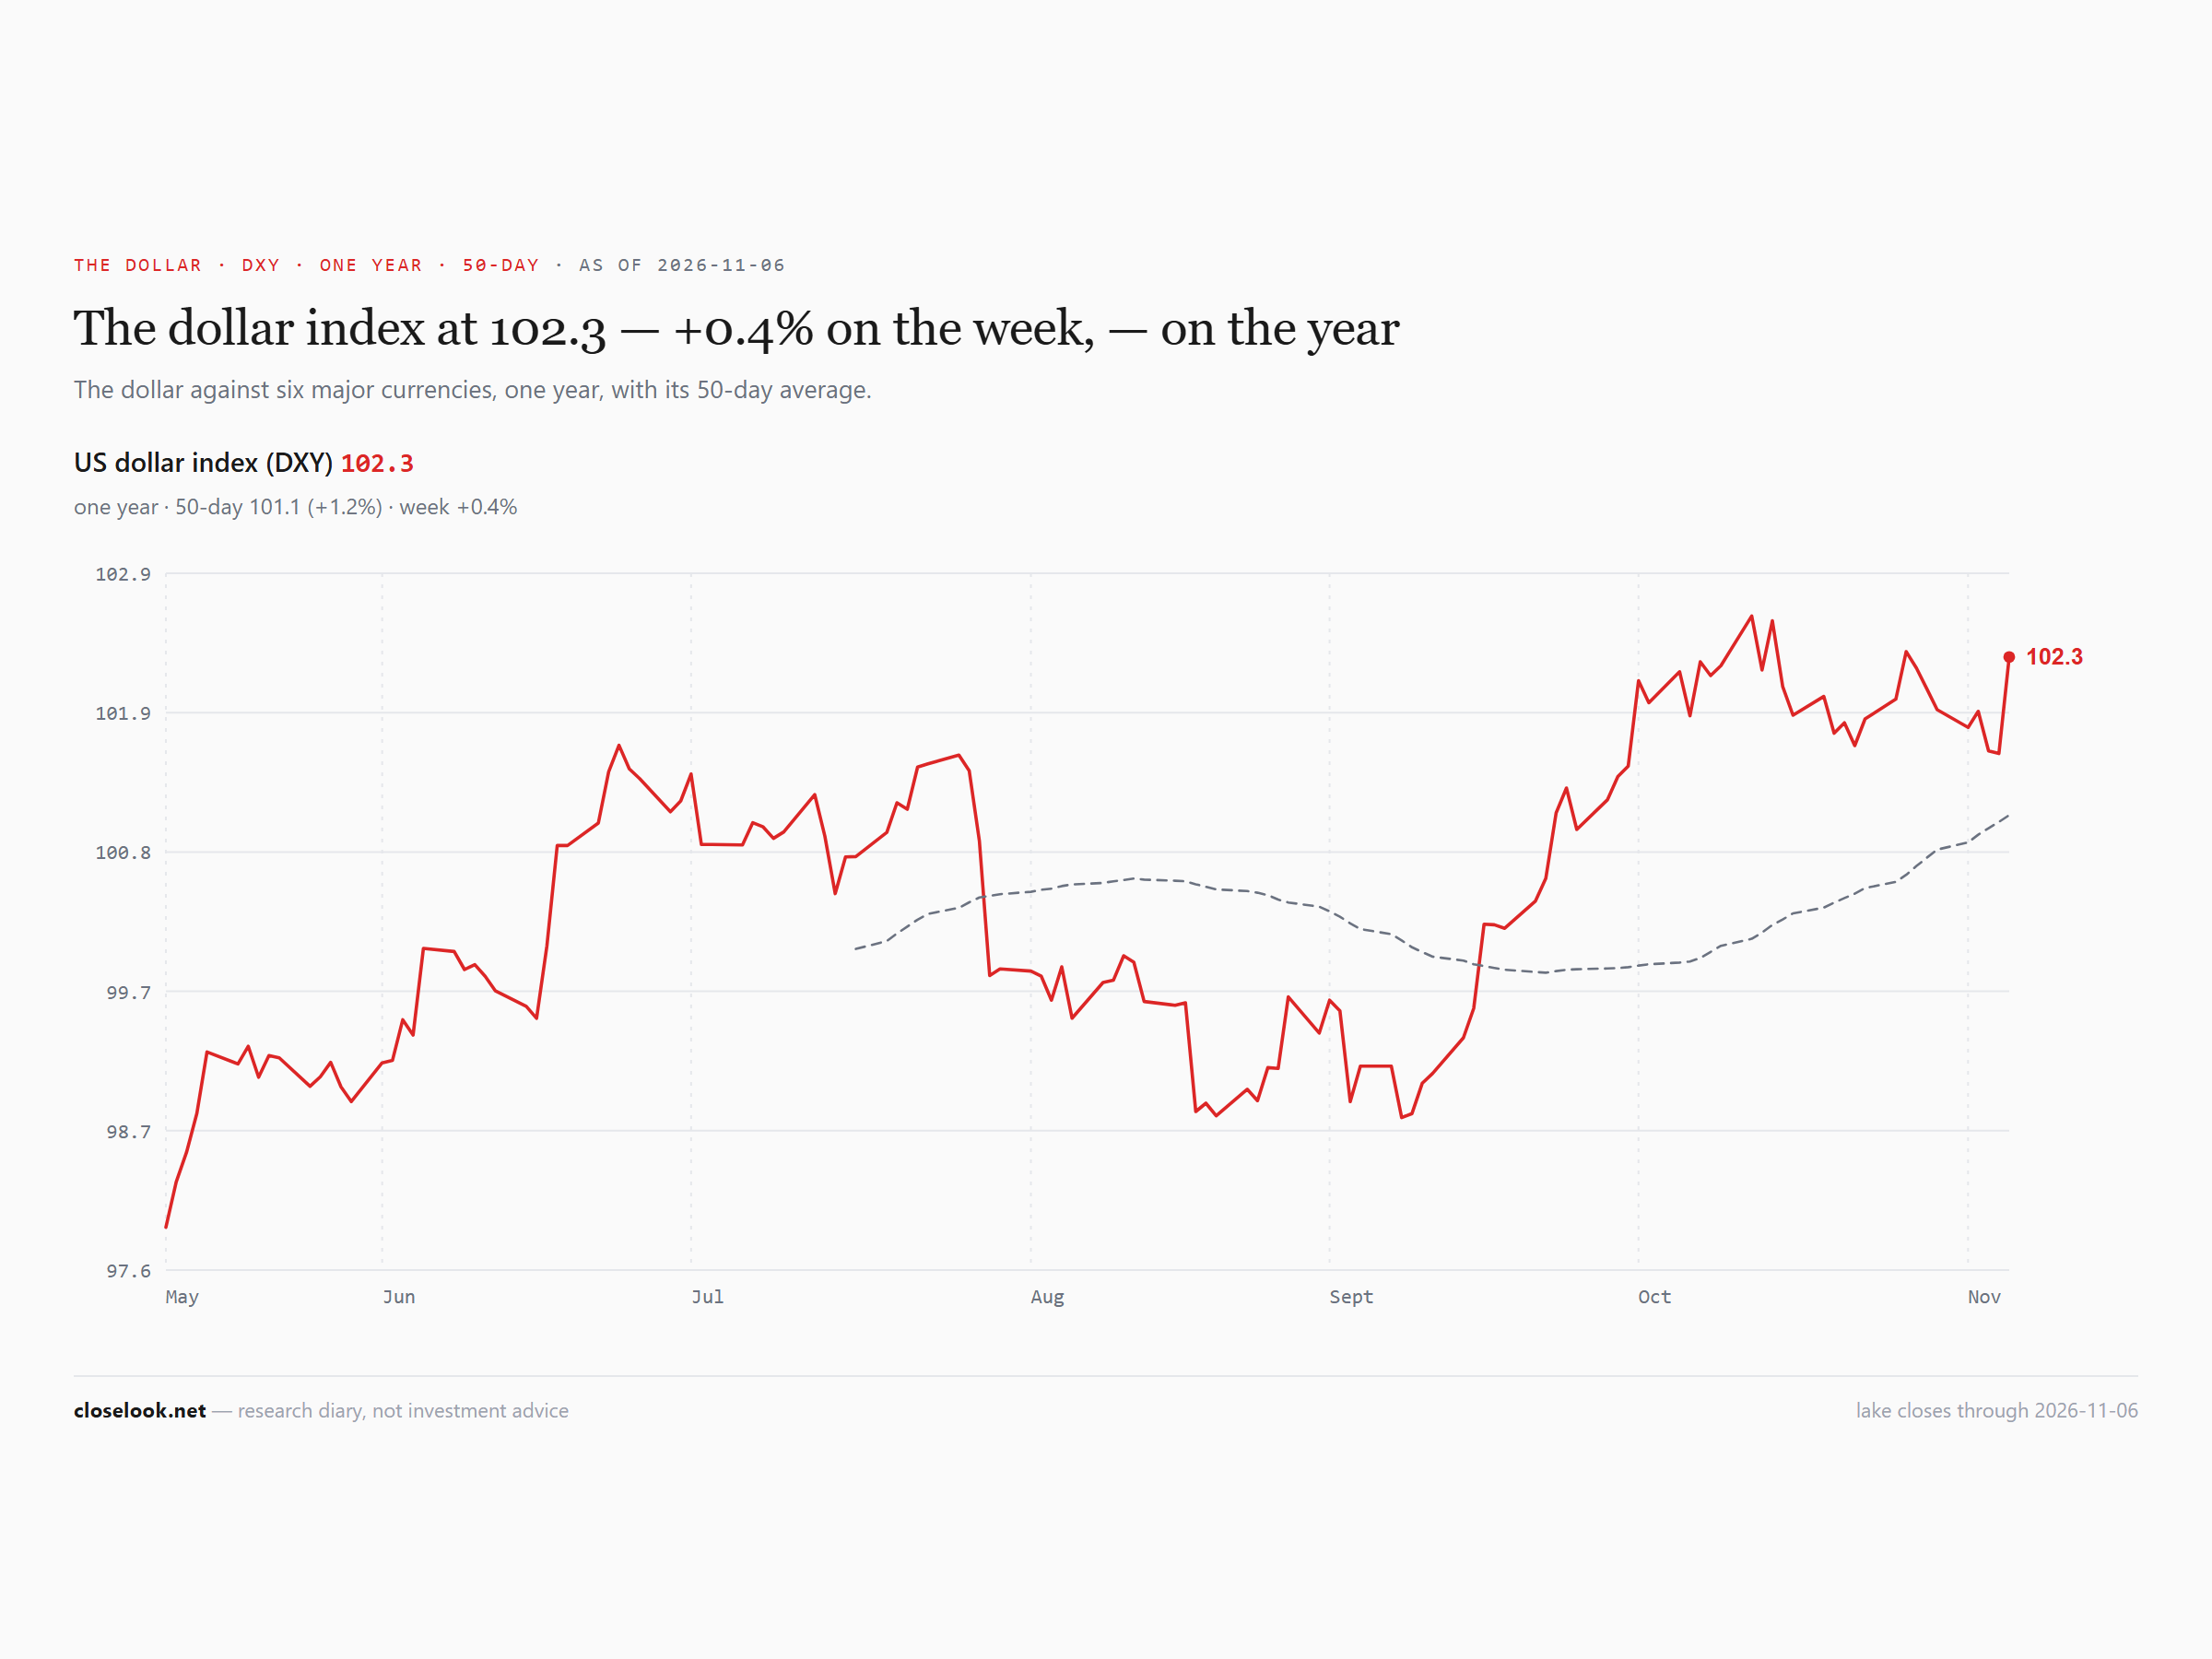
The dollar fund closed at 29.13, +0.45% — level with its 12 October high close. The yen weakened from 157.55 to 158.43 per dollar.
Gold — back above the line
Gold rose 4.71% to 372.52 — back above the 364 support it lost a week ago. On the editor's chart the horizontal line near 364 held the summer lows; last Friday closed under it, at 355.78, the lowest close of the past year. This Friday closed 2.3% above it. The line near 441 stays the year's broken middle. Silver rose 5.09%.
Last week gold fell with the stocks. This week it rose while they fell — and while yields fell too.
2 · The State
The week, in order. Monday: the chip fund fell 3.8% while the equal-weight S&P rose 0.8%; Brent fell 6.5% after the US and Iran signalled openness to talks. Tuesday: Americans voted in the midterms; the chips rose 2.5%; AMD reported after the close. Wednesday: Democrats swept Congress. The Dow rose 2.3%, Apple rose to a record, the equal-weight S&P closed at its high of the past year — and the market sold what the vote may slow: data-centre power stocks fell up to 15%, Vistra 15.3%. Thursday: a call for a pause on advanced AI, a Texas governor-elect who wants a moratorium on new data centres, and a Microsoft spending gap tied to a Texas site all landed on the AI builders at once. AMD fell 13.5%, Nebius 14.2%, Vertiv 12.9%; the chip fund 12.2%, the S&P 4.4%, the Nasdaq 5.5%. Friday: the jobs report, and a bounce — the Nasdaq 100 fund +1.4%, the chip fund +3.5%.
The mechanism, named: the market reversed last week's verdict. Last week it paid the suppliers that beat and sold the spenders — the companies that pay for the AI build-out. This week it sold the suppliers and held the spenders. Amazon rose 7.9%, Alphabet 1.8%, Microsoft 1.7%; Nvidia fell 8.8%, Broadcom 9.9%, AMD 11.1%, Micron 22.0%. None of Thursday's three blows was an earnings miss. Each asked the same question: will the buyers keep spending at this pace? A buyer that spends less keeps more cash; its supplier sells less. The market priced both sides of that in one session.
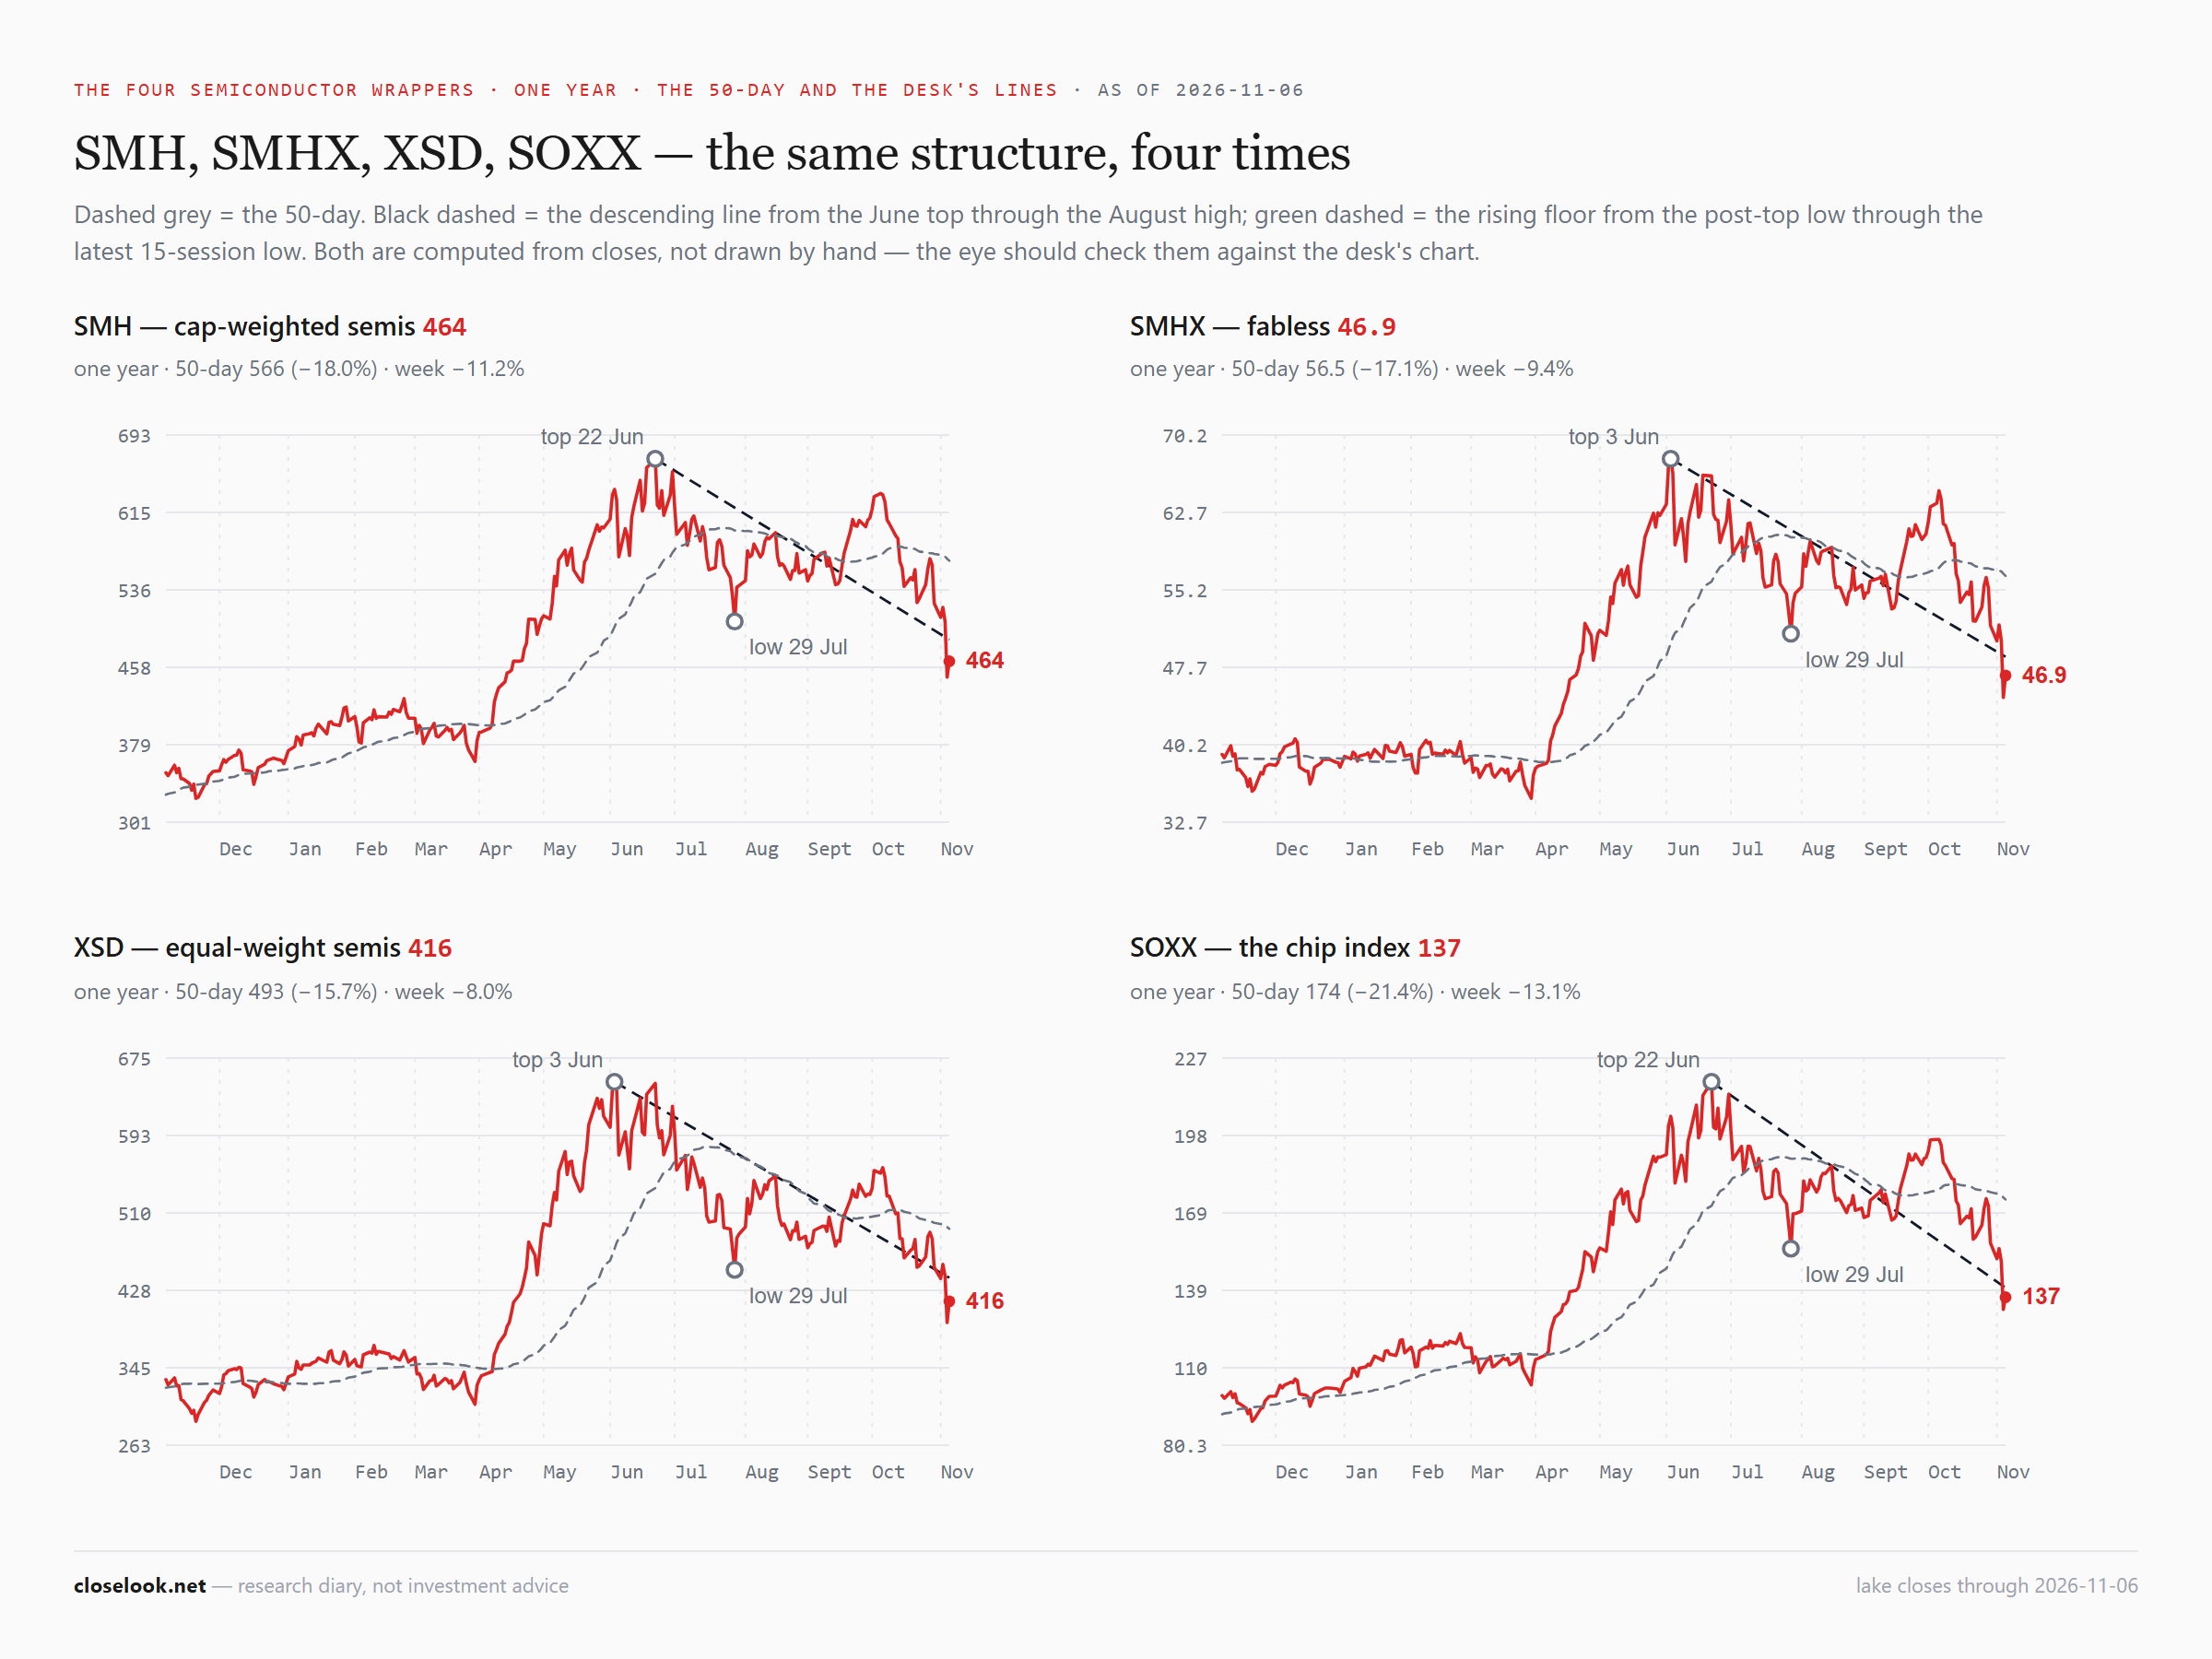
The chips — through the floor. SOXX closed at 136.53, down 13.13% on the week (on the fund's new share basis — last Friday's 471.51 is 157.17 on it). Thursday's close, 131.90, was its lowest since mid-June, under the range it had held since the June 22 high. Friday's bounce left it 37.5% under that high, 21.4% under its 50-day and 14.4% under its 200-day. SMH 463.96, 30.6% under its June high; XSD 415.88, 36.0% under its June 3 high; the fabless fund 46.90, 30.9% under.
This time the large chip names fell harder. Last week's letter watched the ratio of the equal-weight chip fund to the cap-weight one, expecting the small names to lag. It moved the other way: XSD fell 8.0%, SMH 11.2%, and XSD/SMH rose from 0.865 to 0.896. Thursday's selling went to the names with the most AI weight in them.
Software — a smaller fall, still no leader. IGV 98.88, under 100; CLOU 25.85; CIBR 91.04. Four weeks ago software made a high while the chips fell; then it fell with them, then it led, then it fell harder than they did. This week it fell half as far as the chips. Inside tech nothing led. Outside it, health care and staples kept their month.
3 · The Outlook
Read the week in two layers. The bull market that began in late 2022 still holds its line. The legs of it that ran in 2026 — the chips, the software, the AI builders — broke theirs. Which of the two the next weeks confirm is the question for every chart below. The levels are the editor's, checked against the closes.
The line that matters most — the Nasdaq 100 on its 2022 trend line
Two support lines meet at the price. The first is the rising line of the bull market: from the late-2022 low of 260.10 (28 December 2022) through the March low of 558.28 (30 March 2026). The second is horizontal: the 2025 high close of 635.77 (29 October 2025), the top the market broke out of this spring. On the editor's chart the two now meet just under 640. Thursday closed at 647.05, the week's low close; Friday at 656.10, 3.2% above the 2025 high.
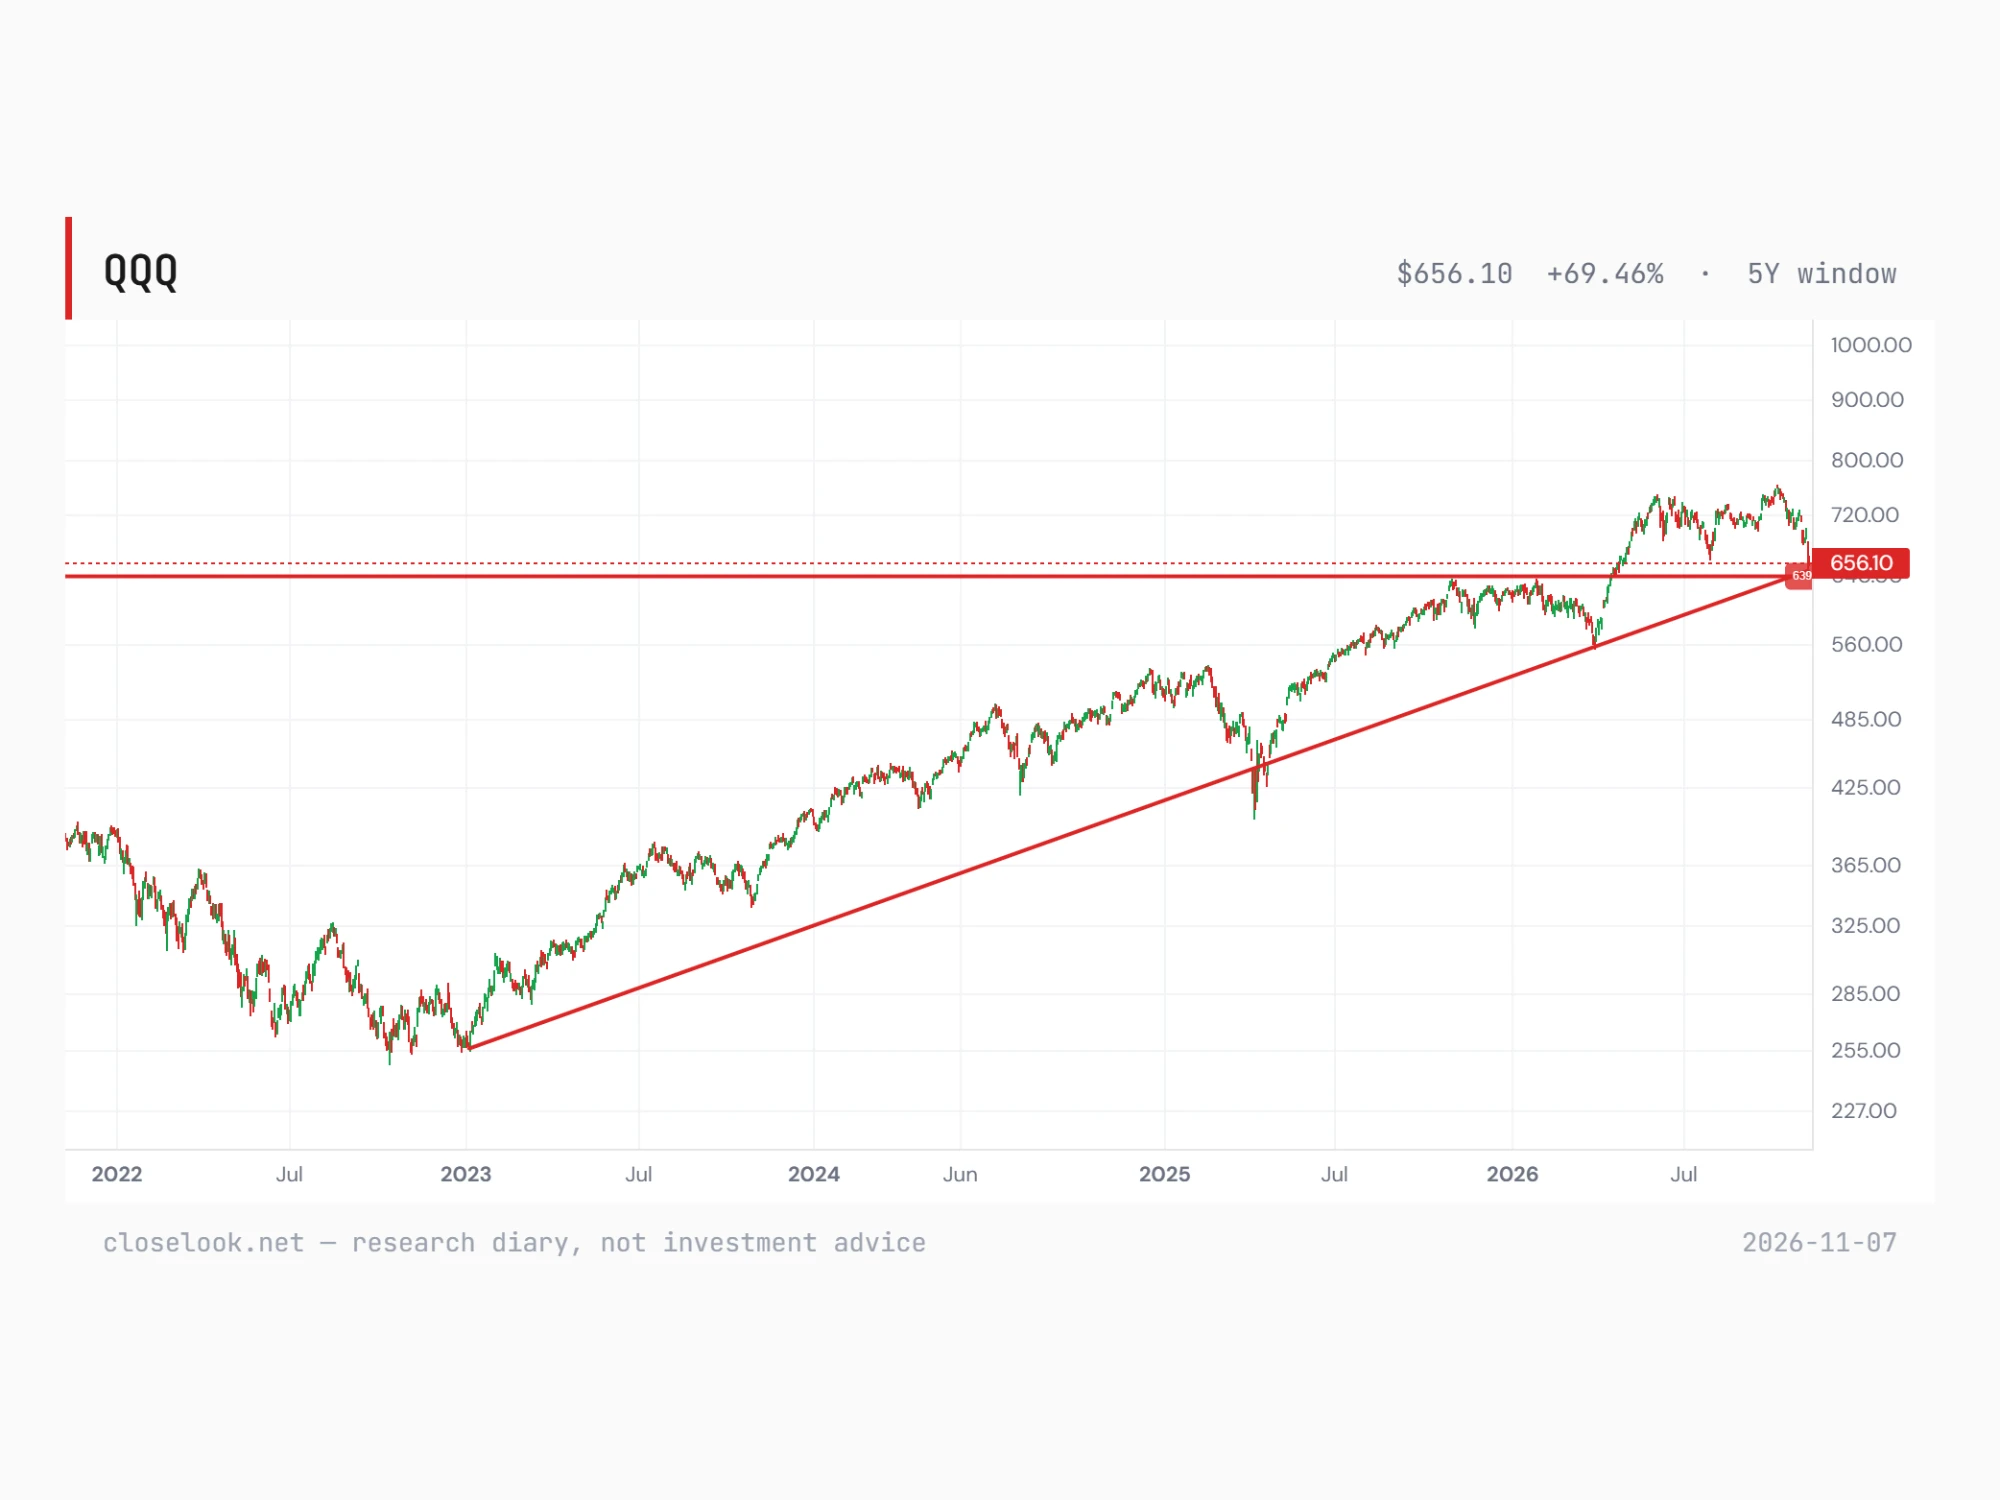
Why this one decides. An old high that becomes support and a three-year trend line in the same place is where a market shows what it is. A weekly close under both would be the first break of the line that has carried the bull market since 2022. A hold there would make this week a fall inside the trend, the kind the stance below was written for. Friday's close sits 3% above it.
Story one — relative strength, at its supports
The index of companies that use AI sits on its floor, with the record just above. It closed Friday at 1,012.0, +0.7% on the week, after a record close of 1,034.8 on Wednesday — the editor's resistance near 1,035. The support is the old highs: 1,012.5 on 25 August and 1,016.0 on 22 October, the ceiling of the past two months, now the floor. Friday closed on it.
The applications index is just above its first line. Agentic Winners closed at 915.94, +0.28%. The editor's supports: around 905 — the September lows of 905.0 (10 September) and 910.6 (18 September) — then around 890, the 893.4 low of 29 September. Friday sits 1.2% above the first. The week ran 915.6, 910.4, 936.8, 927.4, 915.9 and did not touch it.
Health care and the average stock held their trends. Fifty-four of fifty-nine health-care stocks are above their 50-day line; the equal-weight S&P closed Wednesday at its high of the past year. Story one is intact — but its two AI indices now sit on or just above their supports, not above them.
Story two — the floor broke, and the 2026 lines with it
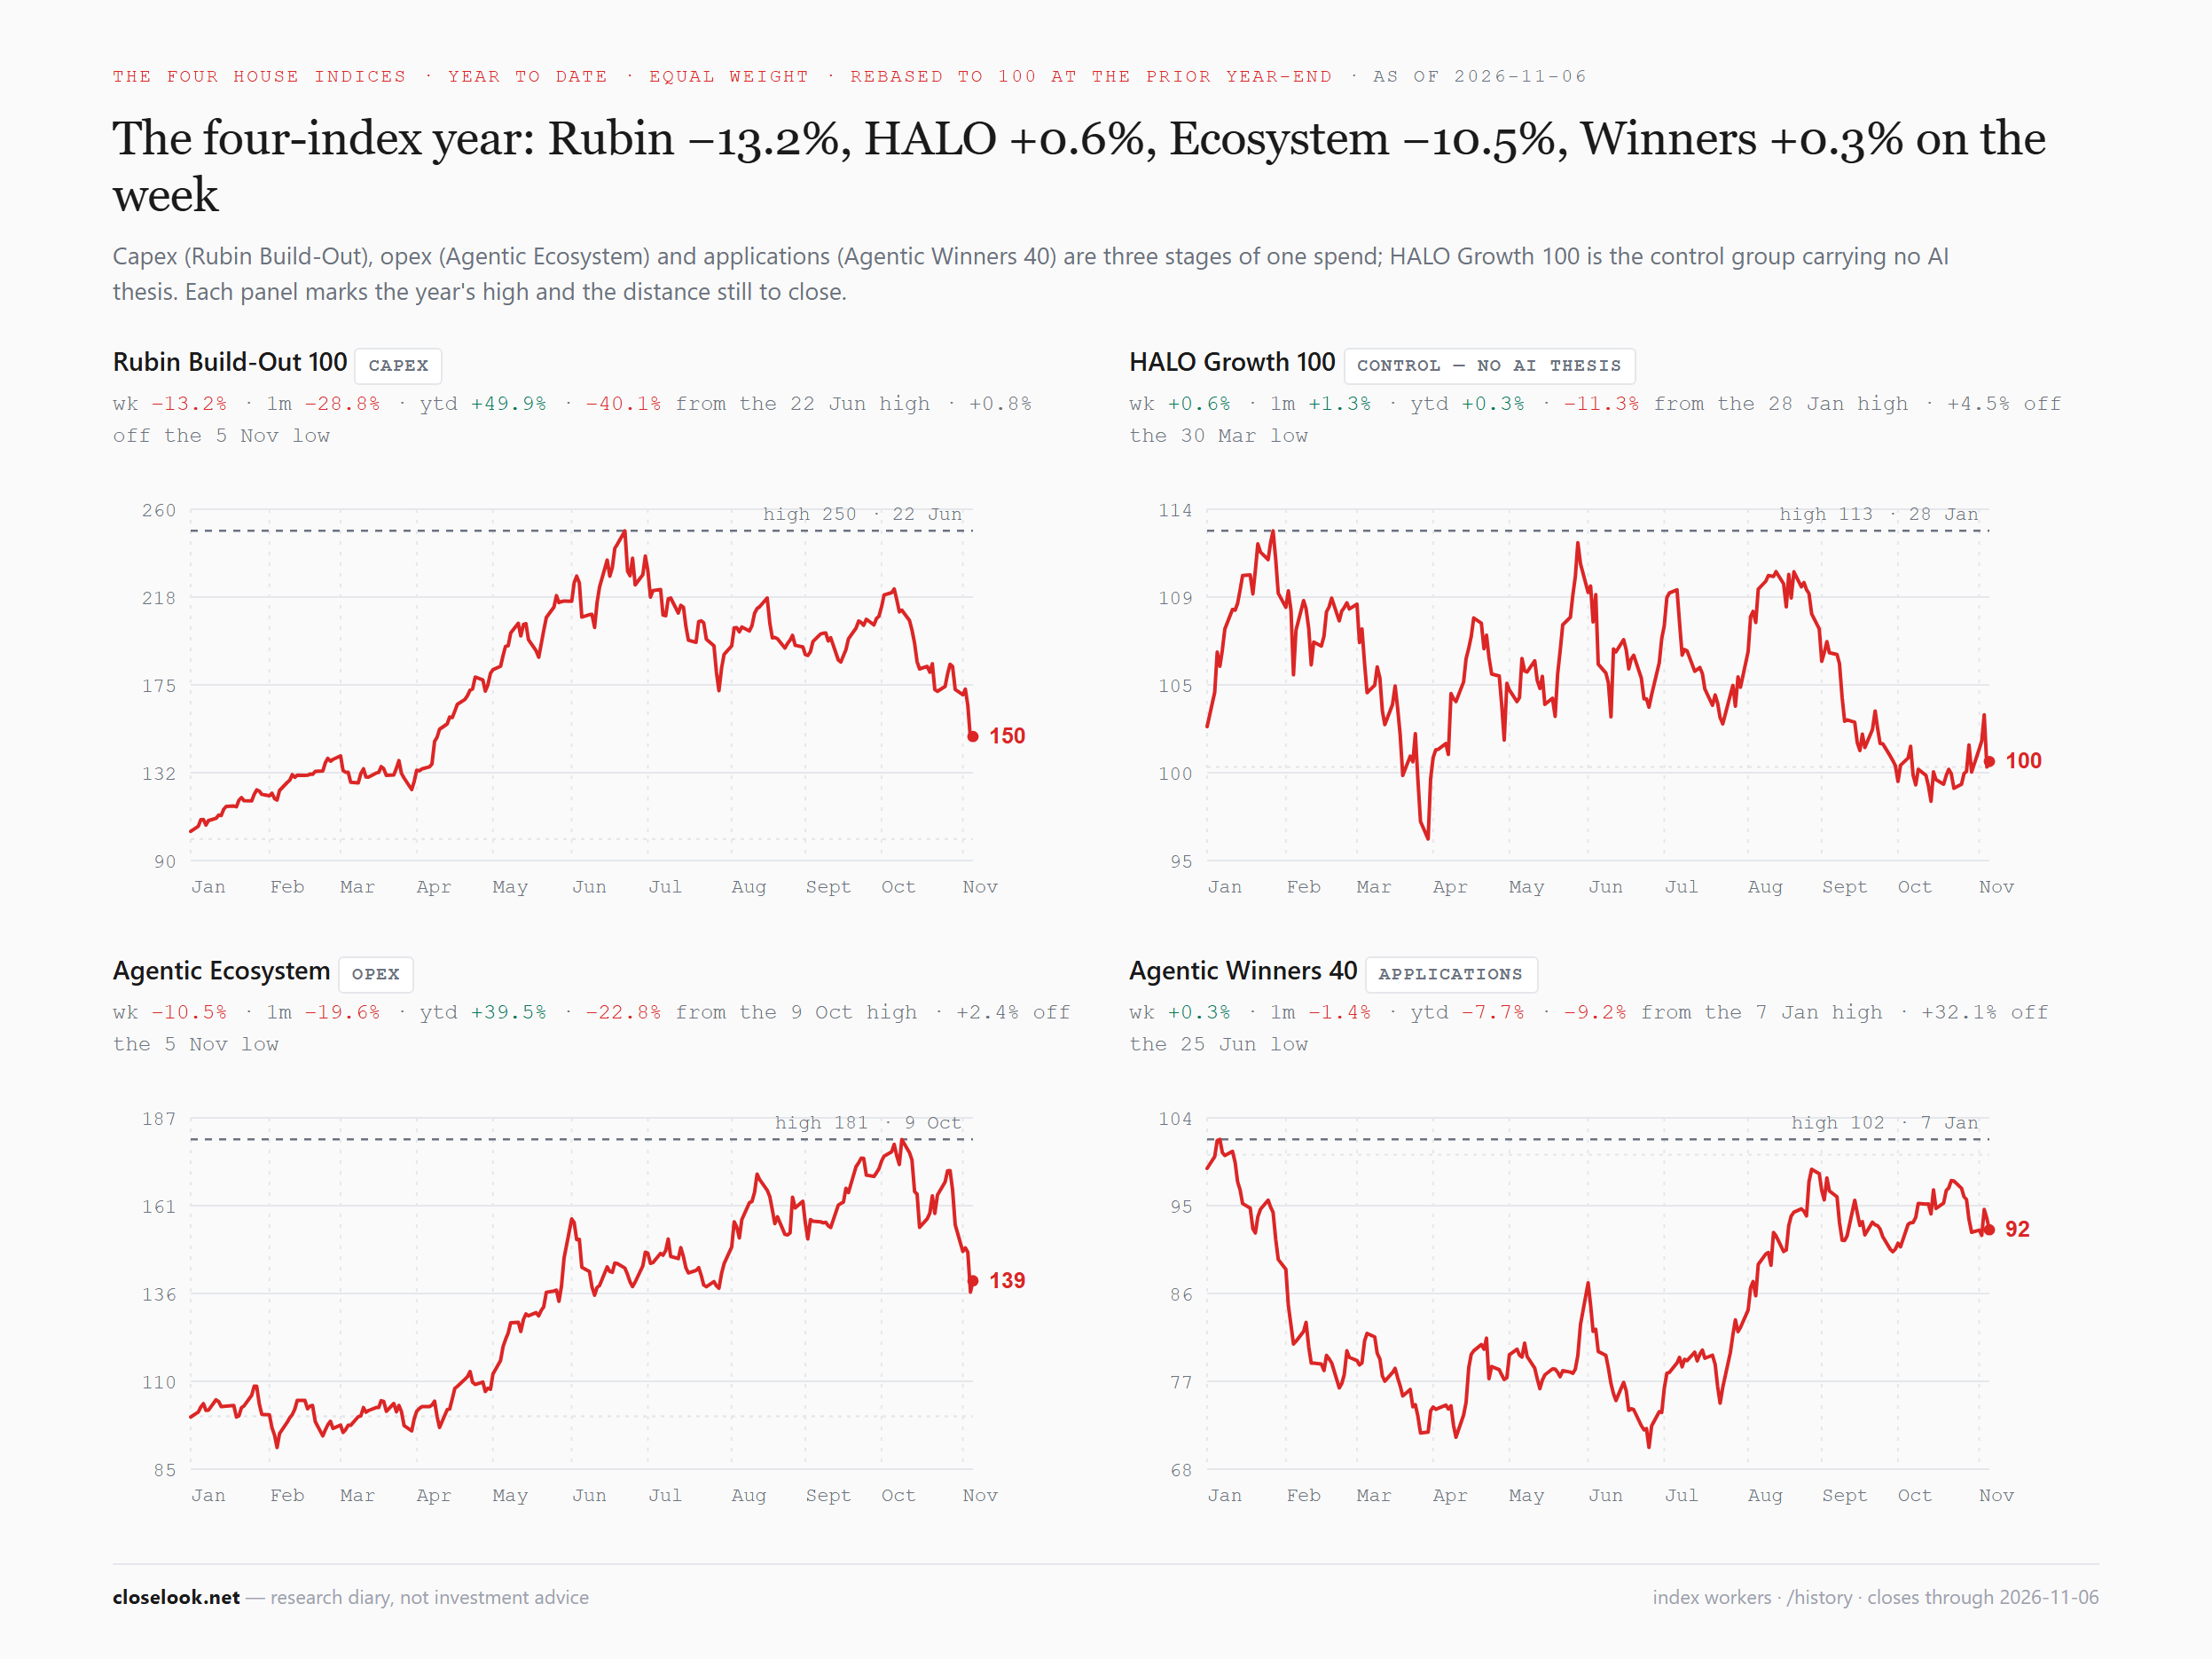
The AI build-out index went through its zone. Last week's zone of 1,704 to 1,735 had held twice, on 29 July (1,707.50) and 23 October (1,703.80). Monday closed under it at 1,686.96; Tuesday back above at 1,714.33; Wednesday under again at 1,636.58; Thursday at 1,473.67. Friday ended at 1,485.88, also under the 61.8% retracement of the 2026 rally at 1,559.55.
The next support: the spring highs, around 1,400. The editor's next line is the top of the first 2026 leg — 1,380 on 25 February and 1,392.82 on 2 March, the peak before the March low of 1,230.12. The April breakout ran from there to the June high of 2,478.59. An old high that turns into support is the classic place for a falling index to stop. It sits 6.3% under Friday's close. Under it, the 78.6% retracement near 1,310.
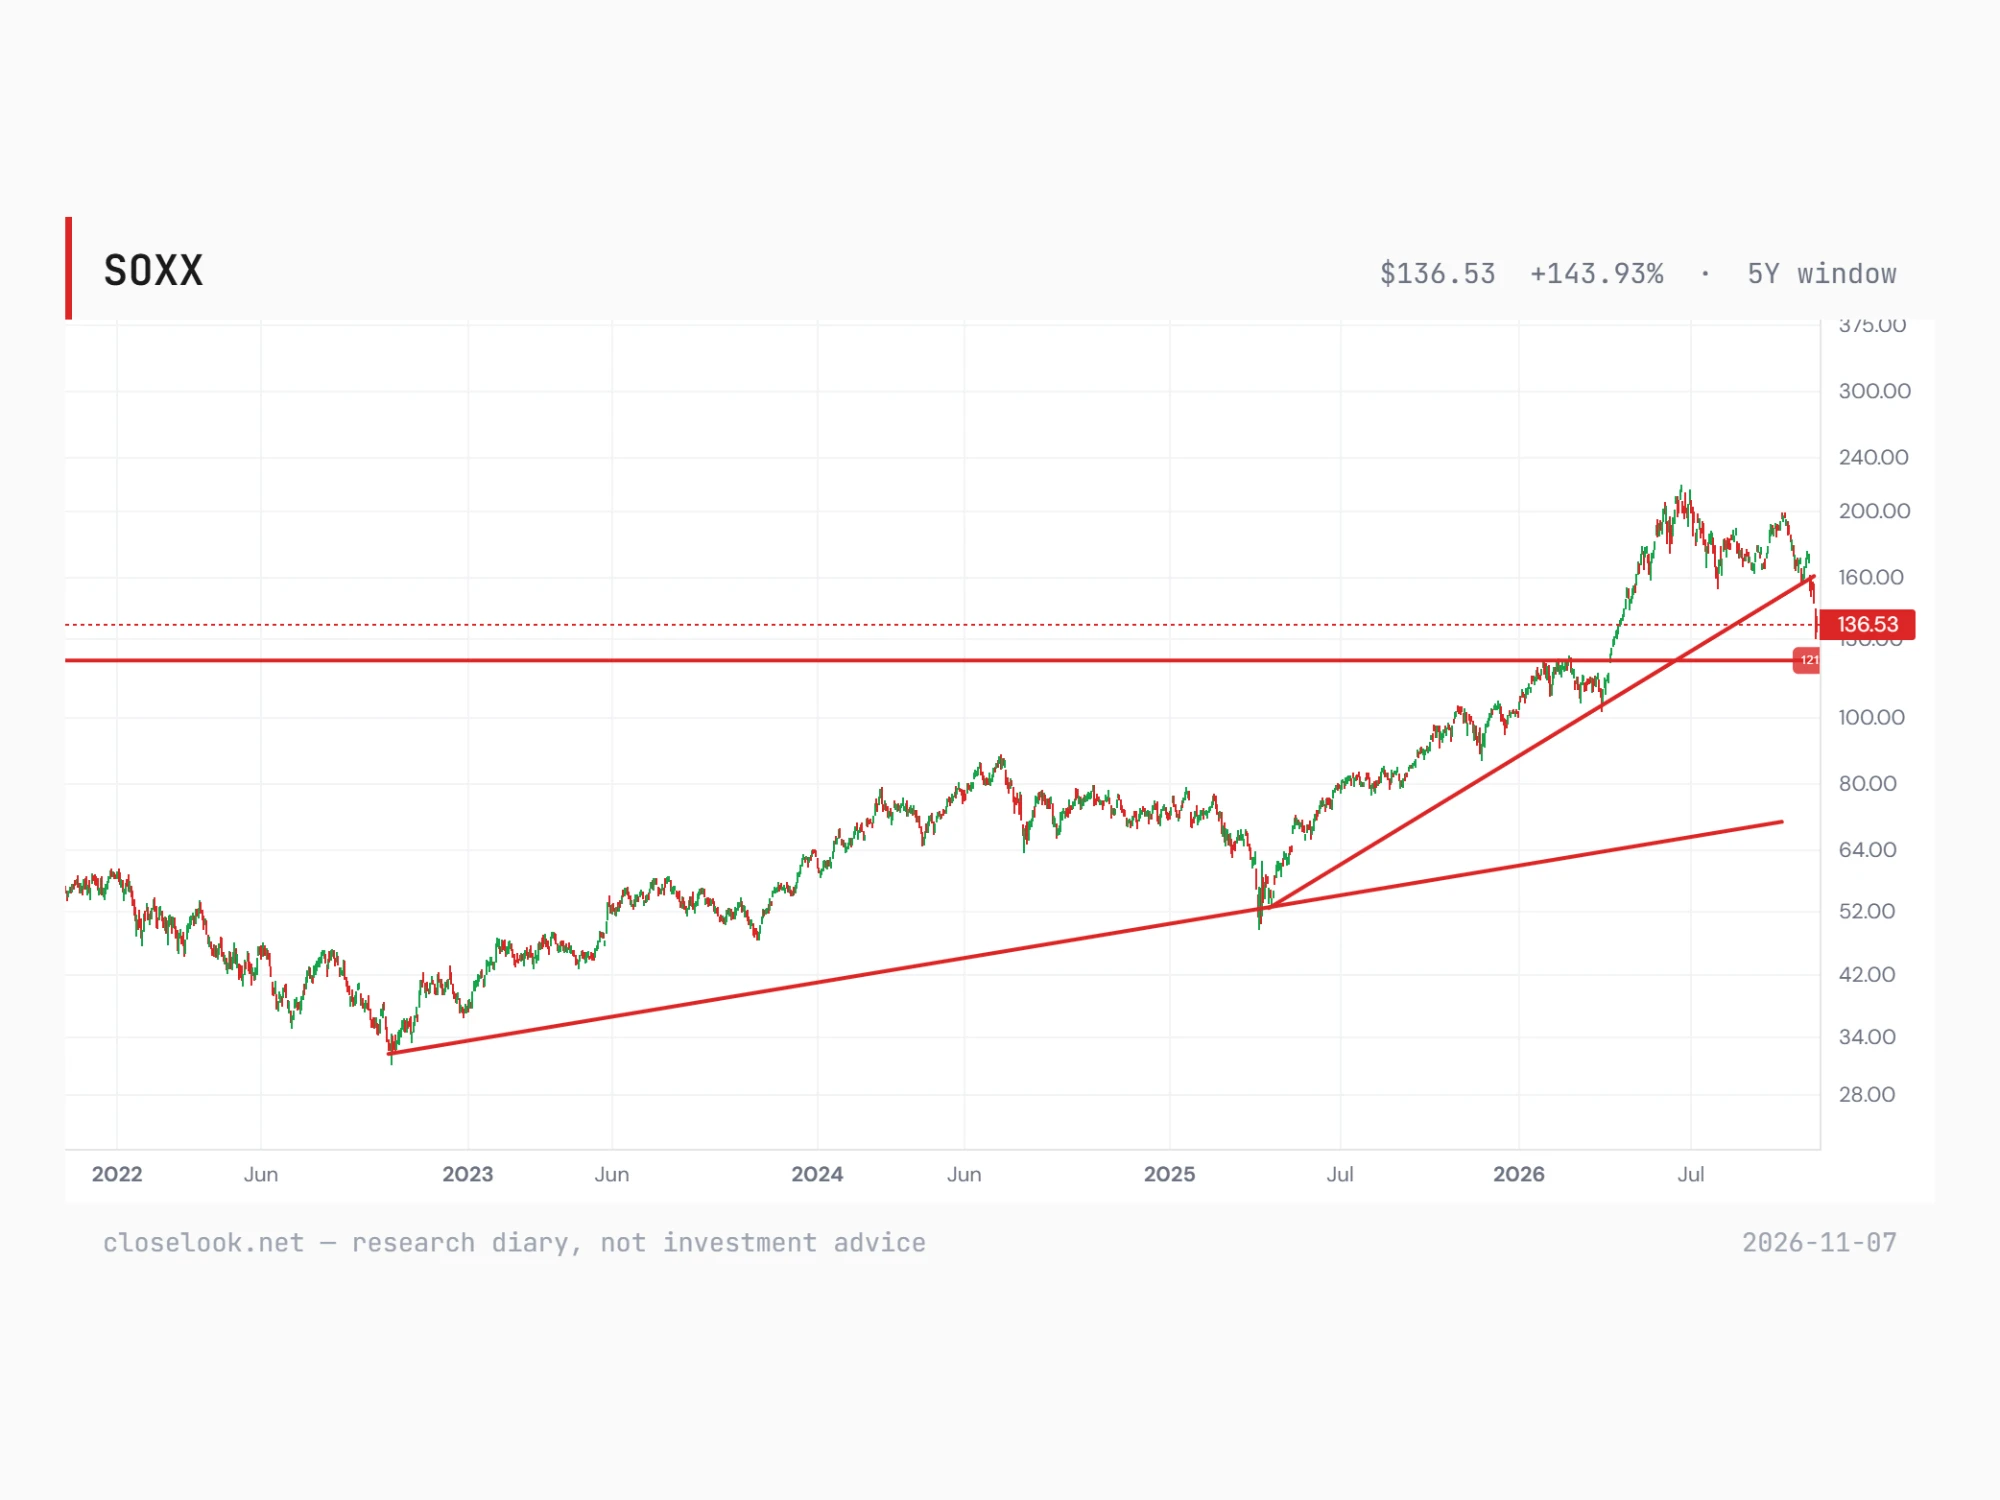
The chips broke the line of the 2025 bull market. The chip fund's rising line runs from the April 2025 low of 51.62 (8 April 2025) through the March low of 103.26 (30 March 2026). This week it closed under it. The editor's support is the February high, 122.67 on 25 February — 10.2% under Friday's 136.53. The fund is 37.5% under its June high.
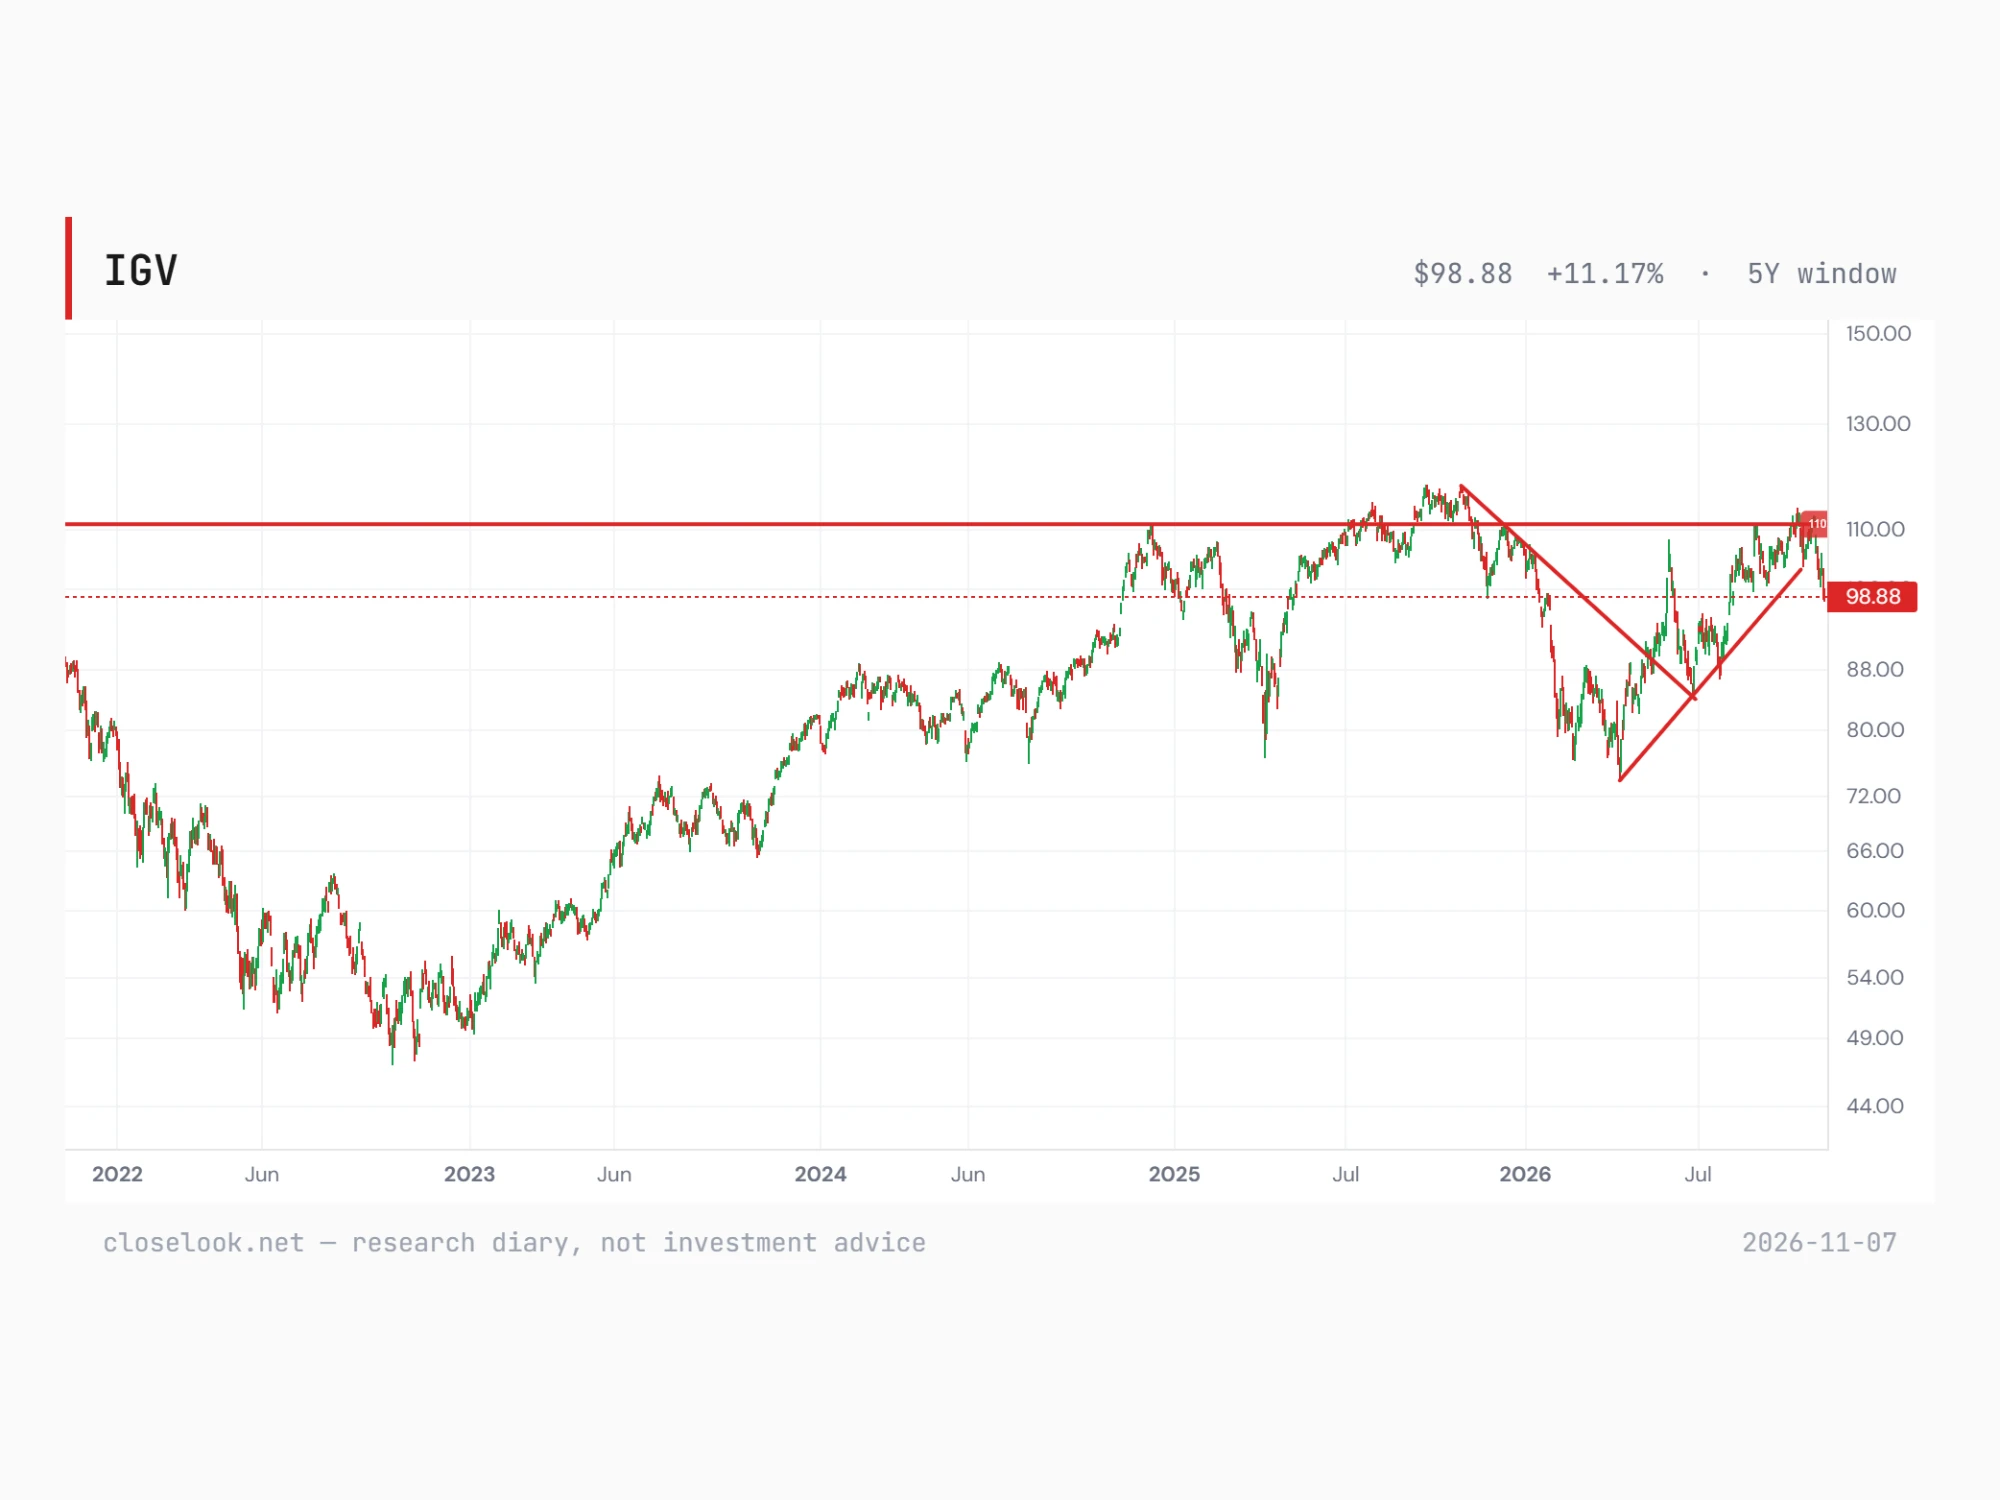
Software broke its 2026 trend — and so did cloud and cybersecurity. The software fund's rising line from the April low of 74.67 (10 April) through the June low of 84.76 (25 June) broke this week; it closed at 98.88, back under the December 2024 high of 110.05 that it got above in October (the year's high, 112.67 on 9 October) and could not hold. On the editor's charts the cloud fund and the cybersecurity fund broke their 2026 lines the same way: cloud closed at 25.85, −7.7% on the week and 15.6% under its 26 October high; cybersecurity at 91.04, −9.9% and 17.2% under its 9 October high.
The runners held one line. The Agentic Ecosystem — the companies that run AI: networks, observability, security — fell 10.5%, but onto a floor: the summer lows of 1,338 (10 June), 1,363 (25 June) and 1,357 (29 July), the editor's 1,340. Thursday closed at 1,346.84, on it; Friday at 1,379.10, 2.9% above. Of the four AI indices, the builders broke, the runners fell onto their floor and held it on the close, and the two others sit on or above theirs.
Between the two
The order of the fall is the order of the rise. In 2026 the AI trade rose in sequence: the builders first, the runners next, the applications and the users last. The falls are arriving in the same order. The builders are 40.1% under their June high, the runners 22.8% under their October record; the applications and the users are within a few points of their supports, the users at a record on Wednesday. The data do not say the last two will follow. They say the first two did.
What separates a fall inside a trend from the end of one is the Nasdaq 100's line. As long as the 2022 line and the 2025 high hold under the index, the broken 2026 lines in the chips and the software read as a correction of the year's fastest legs. A weekly close under that line would turn them into something else. The weekly closes to watch: 636–640 on the Nasdaq 100 fund, 1,010 on AI Users, 905 on the Winners, 1,340 on the Ecosystem, about 1,400 on Rubin, 122.67 on the chip fund.
4 · What May Lie Ahead
The fourth quarter — the frame holds on the average stock, not on the index. This letter's frame for the rest of 2026 stays: a seasonally firm stretch of the calendar, expected to be positive to year-end. This week the S&P fell 2.7% and the Nasdaq 100 4.9%. The equal-weight S&P fell 1.0%, is +12.8% on the year and sits above both its averages; health care is 14.9 points ahead of the S&P over 21 sessions. The frame holds where the breadth is. The index needs the builders back.
The stance — and last week's entry, failed. The stance stays: buy dips, do not chase. Last week this letter called the build-out index's retest of its double bottom "the entry this letter's frame has been waiting for", with a line under it that says when the read is wrong. That line was 1,703.80. Monday closed under it, Tuesday back above, and Wednesday and Thursday under it — Thursday at 1,473.67. The read was wrong. The zone that had held twice broke on the third test, and the index closed under the 61.8% line of its 2026 rally as well. In the relative-strength names — health care, the AI users — a dip is still a pullback inside a trend. In the builders this diary sees no entry until the closes show where the next floor is.
The levels, updated — on the index. Nasdaq 100 26,990 — 27,192 the July low close, now 0.7% above; 28,938 the September low close; 31,224 the record close (6 October); 22,953 the March low close far below. S&P 500 7,377 — 7,819 the record close; the fund's 200-day, 730.38, 0.7% below; its 50-day, 765.68, above. The equal-weight S&P 216.05 — 214.78 its 50-day, 0.6% below; 223.33 Wednesday's high close. The Magnificent Seven fund 67.53 — 70.97 the 50-day above, 66.44 the 200-day below, 74.30 the record close.
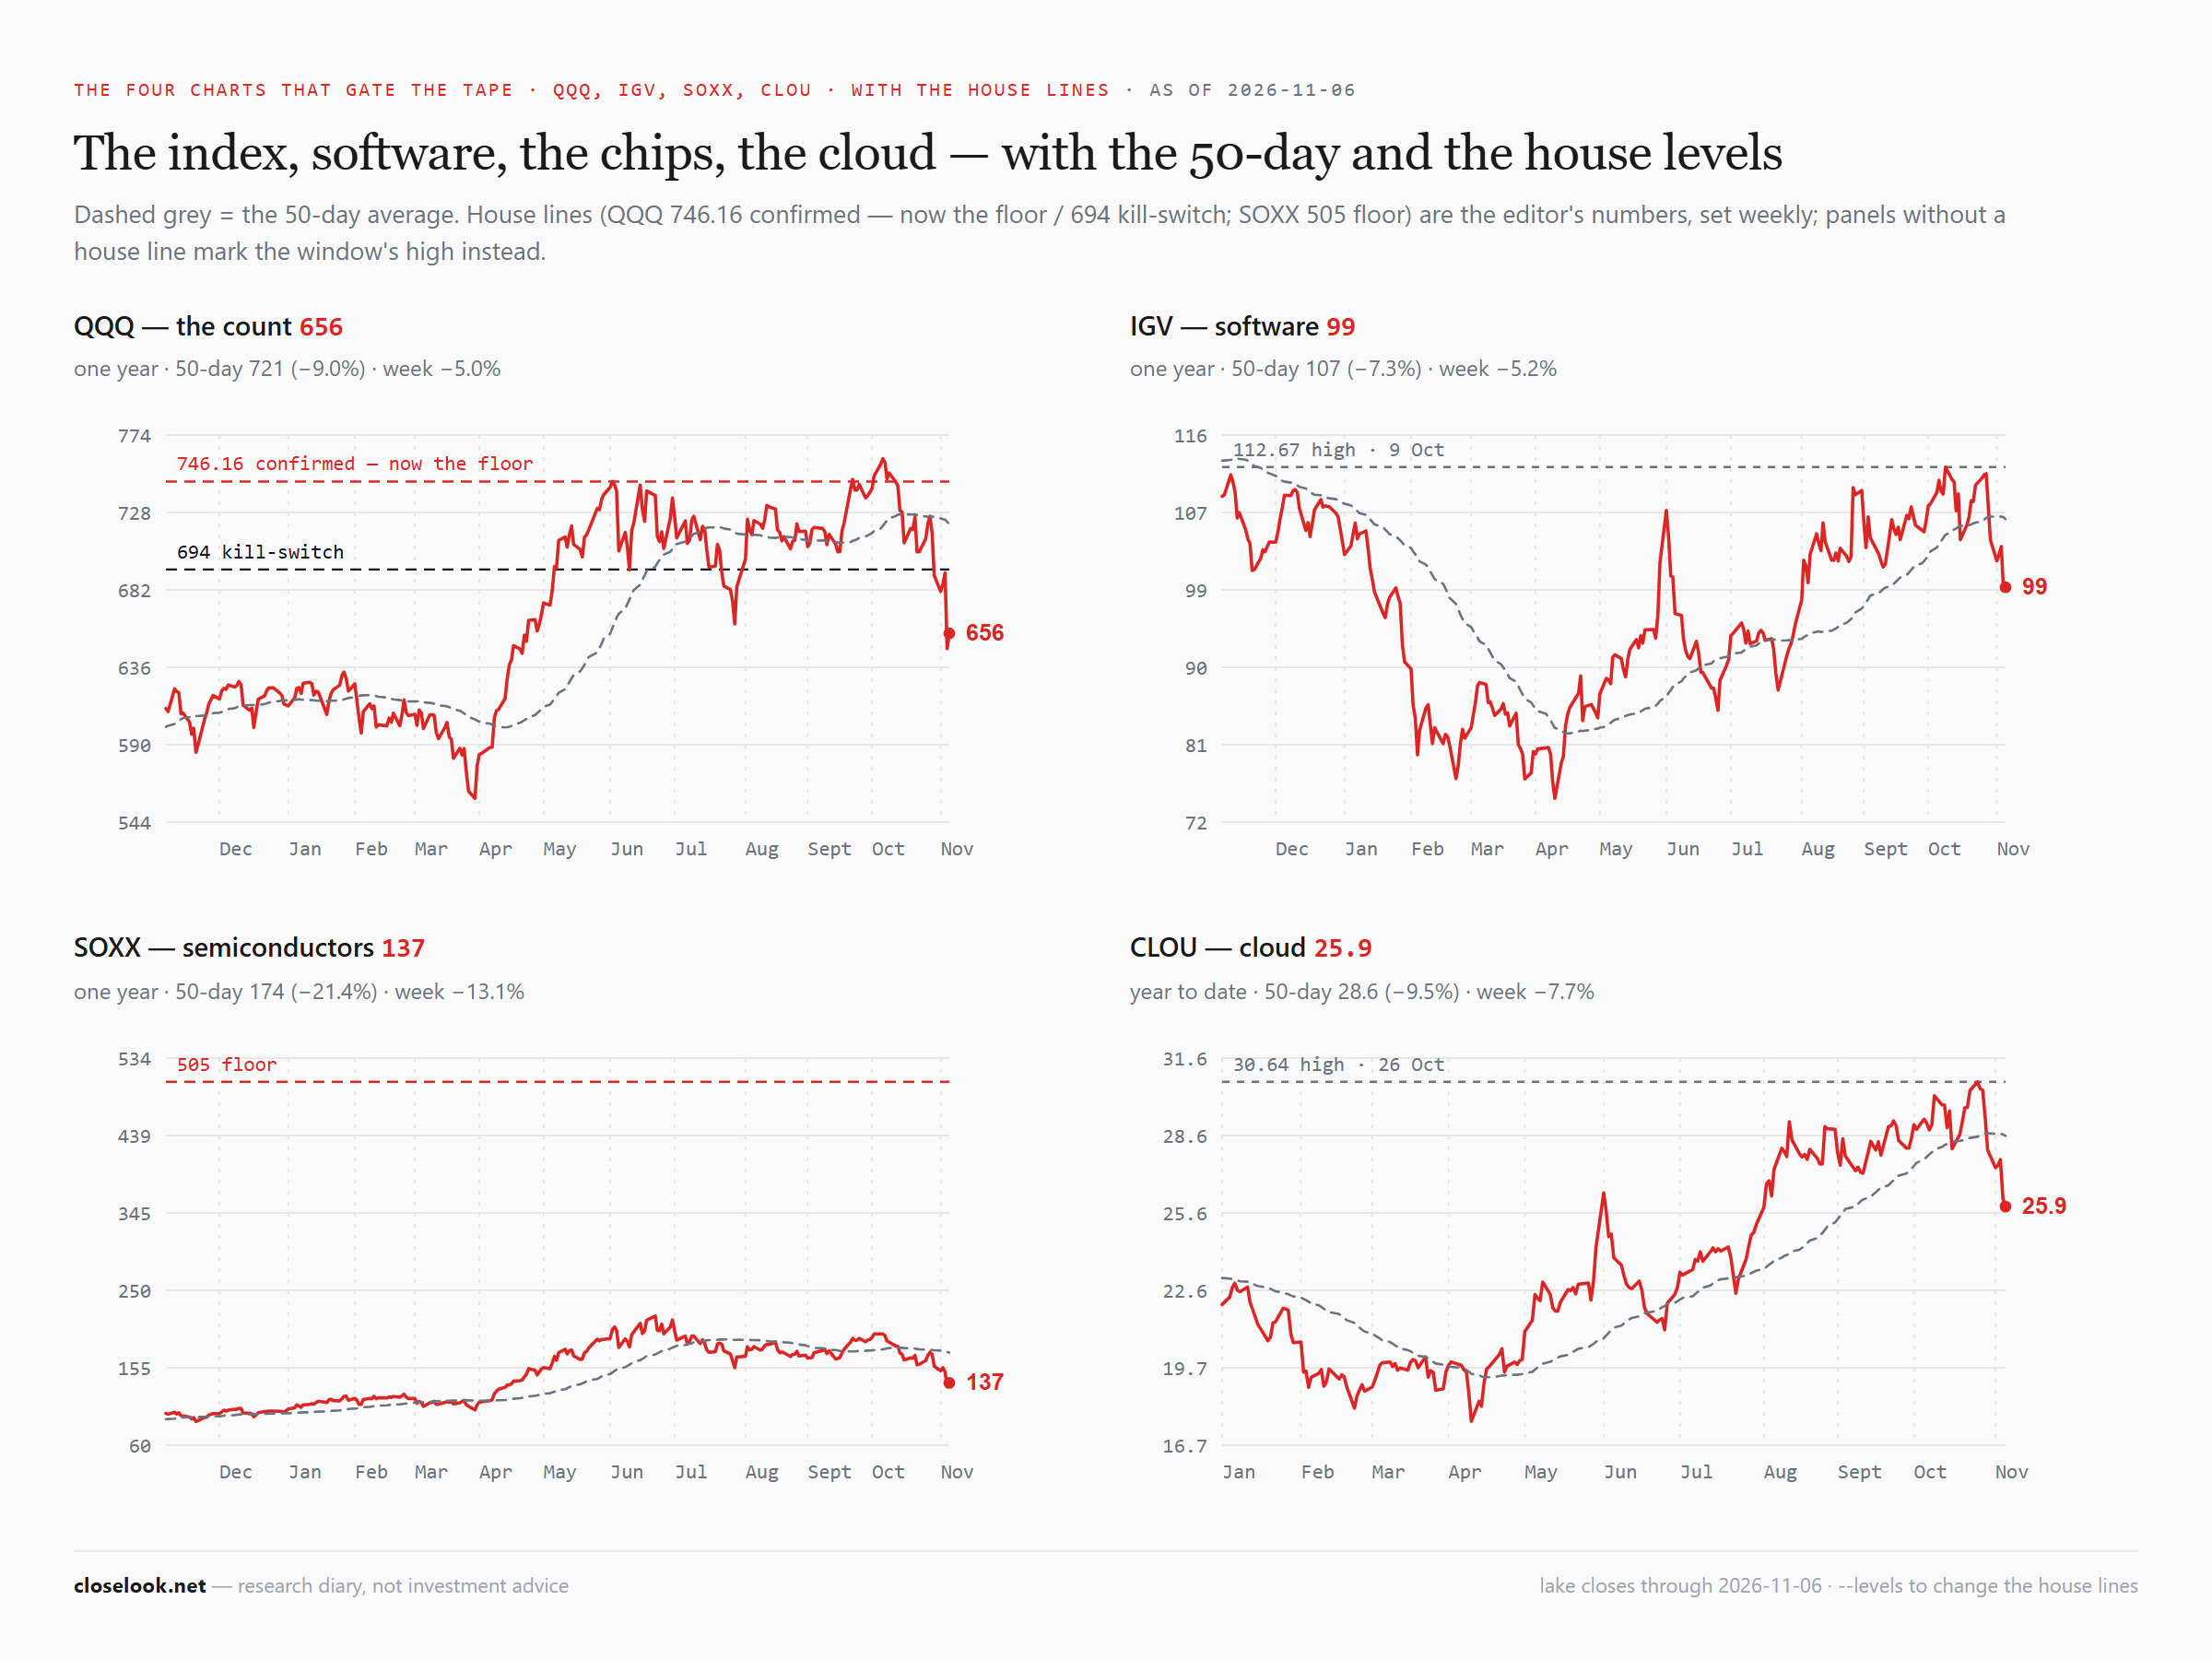
The chips and software. SOXX 136.53 — 131.90 Thursday's close, the low since June; 159.56 the 200-day and 173.66 the 50-day above. IGV 98.88 — 100 above, then 106.71 the 50-day; 94.06 the 200-day below; 112.67 the high of the year. XSD/SMH 0.896, from 0.865.
The AI indices. Rubin 1,485.88 — 1,473.67 Thursday's close just below; the spring highs, 1,380–1,393, the next support, 6.3% under; 1,559.55, the 61.8% retracement, and 1,704–1,735, last week's zone, now above. AI Users 1,012.0 — on the 1,010 support; 1,034.8, Wednesday's record, the resistance. Agentic Ecosystem 1,379.10 — 1,340, the summer lows, held on Thursday's close of 1,346.84. Agentic Winners 915.94 — 905 the first support, 1.2% below; about 890, the 893.4 low of 29 September, the second.
The week's calendar. Monday 9 November: four print windows are graded at the close — Datadog, Novo Nordisk, Coherent, MercadoLibre. Tuesday 10 November: four more — Cloudflare, JFrog, Applied Optoelectronics, IREN. Friday 13 November: the next weekly close. 9 December: the Fed, with new projections.
The print record
How the record works. When a company reports, the record takes the stock's closing price on the entry day and follows it over the next scoring days; that stretch is the window. Paid means the stock was up at least 3% at the end of the window. Sold means it was down more than 3%. Flat is anything in between. The record measures whether the market rewarded the report, not whether the report was good.
Fourteen windows closed this week: two paid, two flat, ten sold.
Monday 2 November: one paid, three sold. Lilly paid, +9.5%. Alphabet sold, −14.1%; Microsoft sold, −4.5%; ServiceNow sold, −29.4%. Microsoft had sat inside the band at last week's close; Monday's close took it under.
Tuesday 3 November: one flat, two sold. Amazon flat, +2.8% — 41 cents short of paid. Twilio sold, −11.6%. Intel sold, −34.2%, the deepest window on its card.
Thursday 5 November: one flat, one sold. Apple flat, +1.7%. Palantir sold, −13.1%.
Friday 6 November: one paid, four sold. Shopify paid, +4.4%. AMD sold, −7.2%; Eaton sold, −12.8%; Dynatrace sold, −7.6%; DigitalOcean sold, −19.9%.
Still open. Graded on Monday 9 November: Datadog, Novo Nordisk, Coherent, MercadoLibre. Graded on Tuesday 10 November: Cloudflare, JFrog, Applied Optoelectronics, IREN. Cloudflare's entry is 244.51; on Friday's close of 268.75 it stood 9.9% above it.
5 · The AI Build-Out Portfolio
AI Buildout — 36 positions · unrealized +12.6% · benchmark Nasdaq-100 · snapshot Nov 10, 2026
| # | Symbol | Name | Weight | Unreal. |
|---|---|---|---|---|
| 1 | US Dollar | — | 18.2% | +0.0% |
| 2 | TOELY | — | 14.3% | +459.4% |
| 3 | NET | — | 4.0% | +56.1% |
| 4 | FROG | — | 3.6% | +38.8% |
| 5 | SIEGY | — | 3.3% | -2.7% |
| 6 | CIBR | — | 3.3% | +6.4% |
| 7 | ABNB | — | 3.2% | -1.6% |
| 8 | BB | — | 3.2% | -10.4% |
| 9 | TSM | — | 3.1% | +8.8% |
| 10 | ATEYY | — | 3.0% | -1.0% |
| 11 | NVDA | — | 2.9% | -7.4% |
| 12 | PLTR | — | 2.9% | +17.8% |
| 13 | AVGO | — | 2.9% | +2.7% |
| 14 | IOT | — | 2.9% | +51.7% |
| 15 | RBRK | — | 2.9% | +100.4% |
+ 21 more positions · full per-position cost basis & P&L is C+ subscriber-only.
What we did this week: four out, four in. Thursday: the book sold 50 Natera at 364.00, a realised gain of $7,887, and bought 200 JFrog at 74.62 and 100 Shopify at 143.75. Friday: it sold 100.22 Kulicke & Soffa at 64.01 (−$5,774 realised), 30.03 MKS at 192.27 (−$6,418) and 125.09 Qnity Electronics at 117.00 (−$3,154), and bought 50 Accenture at 260.50 and 100 Airbnb at 189.99. Realised on the week: about −$7,460. Saturday's Pulse has the five books' full ledger.
The swap, in one line: three chip-supply lines out at a loss, one health-care line out at a profit; software, commerce, IT services and travel in. JFrog closed Friday at 100.98, 35.3% above the book's price, about +$5,270 on the line; Shopify at 148.91, +3.6%. Friday's house flow scan listed Accenture among the names turning up; Airbnb rose 15.6% on the week. A research diary, not a recommendation.
The book, marked — about $51,100 lower by the engine. The held equity lines closed Friday at $534,523 against $585,619 on last Friday's closes — down $51,096, or 8.7%, by the engine mark: units times Friday's closes. Two corrections to read it by. The tracker still quotes the Tokyo Electron ADR at its pre-split price, a sixth week, so that line is overstated; without it, the held lines lost about $48,300. And the four new lines are not yet in the mark.
What paid it — little. Tempus AI +5.3% (+$766), BlackBerry +3.8% (+$640), Alphabet +2.1% (+$286). What charged it — the builders and the software: Datadog −23.9% (−$4,217), Advantest −16.6% (−$3,398), ASE Technology −19.9% (−$3,173), Rubrik −14.8% (−$2,760), DigitalOcean −19.2% (−$2,575), Palantir −12.9% (−$2,373), SK Hynix −14.7% (−$2,187), the cybersecurity fund −9.9% (−$2,000).
The four the books own, not trade. Nvidia −8.8% (−$1,804), TSMC −7.6% (−$1,386), SK Hynix −14.7% (−$2,187), Advantest −16.6% (−$3,398) — together about −$8,780 in this book. All four sit in both the AI Build-Out and the Hypergrowth books. The AI Build-Out book traded none of them this week; Hypergrowth added 50 TSMC and 20 SK Hynix shares on Friday, bringing each line to about 100 shares, and sold a call against each. Last week they held up better than the rest; this week they fell with it. How the vehicles work lives on the Trade the Look page.
What we plan to do — act on the close. The swap is done, and the book carries less chip supply than a week ago. The diary's rule stays: add on weakness, act on the close, and only where the closes show a floor.
6 · What May Go Wrong
One: the break runs. The build-out index closed 0.8% above Thursday's 1,473.67. A weekly close under it would say Friday's bounce was only a pause, and that the old zone at 1,704–1,735 is now a ceiling. §3 names the next lines.
Two: the third rung goes. The Agentic Ecosystem already closed under 1,533.24, the trough last week's letter named as the line between pause and breakdown. Agentic Winners, at 915.94, is 2.5% above its 893.39 trough. A weekly close under it would mean all three stages of the AI spend have broken a line in the same month.
Three: the average stock joins. The equal-weight S&P is 0.6% above its 50-day of 214.78. A close under it would say the selling has left tech and reached the rest — the one thing this autumn's frame does not survive. Financials and industrials are the tell: 46 of 76 and 47 of 80 members sit above their 50-day, but only 14 and 17 above their 5-day.
Four: the Nasdaq fails to retake July. The Nasdaq 100 is 0.7% under its July low close of 27,192; the fund is 3.6% under its 200-day. A second weekly close under both would turn July's low from a floor into a ceiling.
Five: the jobs bring the hike. 165,000 payrolls against about 60,000 expected is a reason for the Fed to do on 9 December what the futures priced before the report. A ten-year back above 5.0% would take away the support that health care and staples, this month's leaders, have had from falling yields.
7 · Knowledge Corner
Retracements, part two — what it means when 61.8% breaks. Last week this corner explained the arithmetic: when a market rises and then falls back, a retracement is the share of the rise that the fall gives back. The marks most chart readers watch are 38.2%, 50% and 61.8%. This week the build-out index went through the last of them, so here is what that usually means.
The build-out index, mark by mark. The 2026 rally ran from 991.47 at the end of 2025 to 2,478.59 on 22 June — a rise of 1,487 points.
| Retracement | Level | Status on 6 November |
|---|---|---|
| 38.2% | 1,911 | Broken in the summer fall |
| 50% | 1,735 | The zone that held twice; broken this week |
| 61.8% | 1,560 (1,559.55) | Broken on Thursday |
| 100% | 991 | The whole rally given back |
Where it stands. Friday's close of 1,485.88 has given back about 67% of the rally; Thursday's close of 1,473.67, about 68%. That is past the last of the common marks.
What a break of 61.8% usually means. Three things. First, the fall is no longer read as a normal pullback. Up to about half, a correction in a rising market is routine; past 61.8%, chart readers stop assuming the old trend resumes on its own. Second, a floor that breaks often turns into a ceiling. The levels where buyers stepped in on the way down — here 1,704 to 1,735 — are where sellers tend to wait on the way back up. Third, attention moves to older prices: the places where the rally paused on its way up, long before the high. Those are the lines §3 will name.
What it does not mean. It does not say the rally is over, and it does not give a target. A break is confirmed by closes, not by one session — a quick weekly close back above 1,559.55 would make this a false break, and false breaks at the 61.8% line are common. Closelooknet reads it as a probability with a line on each side, not as a promise: under the line the odds of a deeper correction rise; back above it, they fall again.
8 · Final Words
The companies that build AI broke the floor they had held since the summer. The chip fund fell 13 percent in a week, 12 of it on Thursday, when a call for a pause on advanced AI, a Texas moratorium idea and a spending gap at Microsoft landed on the builders together. The build-out index closed under the zone that had held twice and under the 61.8 percent line of its 2026 rally. Last week this letter called that zone an entry, with a line under it that said when the read would be wrong. Thursday said it.
The average stock barely moved. The equal-weight S&P fell 1 percent and is up almost 13 percent on the year, above both its averages. Health care is 15 points ahead of the index over a month, with 54 of its 59 members above their 50-day line, and the index of companies that use AI made a new high on Wednesday. The giants that pay for AI held; the companies that sell it to them did not.
Fourteen windows closed on the print record, and two paid. The AI Build-Out book sold three chip-supply lines and bought software, commerce, IT services and travel.
Price is the only truth. 1,559.55 on the build-out index, 27,192 on the Nasdaq 100, 214.78 on the equal-weight S&P, 131.90 on the chip fund and 5.0% on the ten-year will say whether the builders' break spreads to the rest of the market or stays where it started.