Daily Pulse · · 13:00 CET · 5 min read · market


In this edition
Pattern alerts
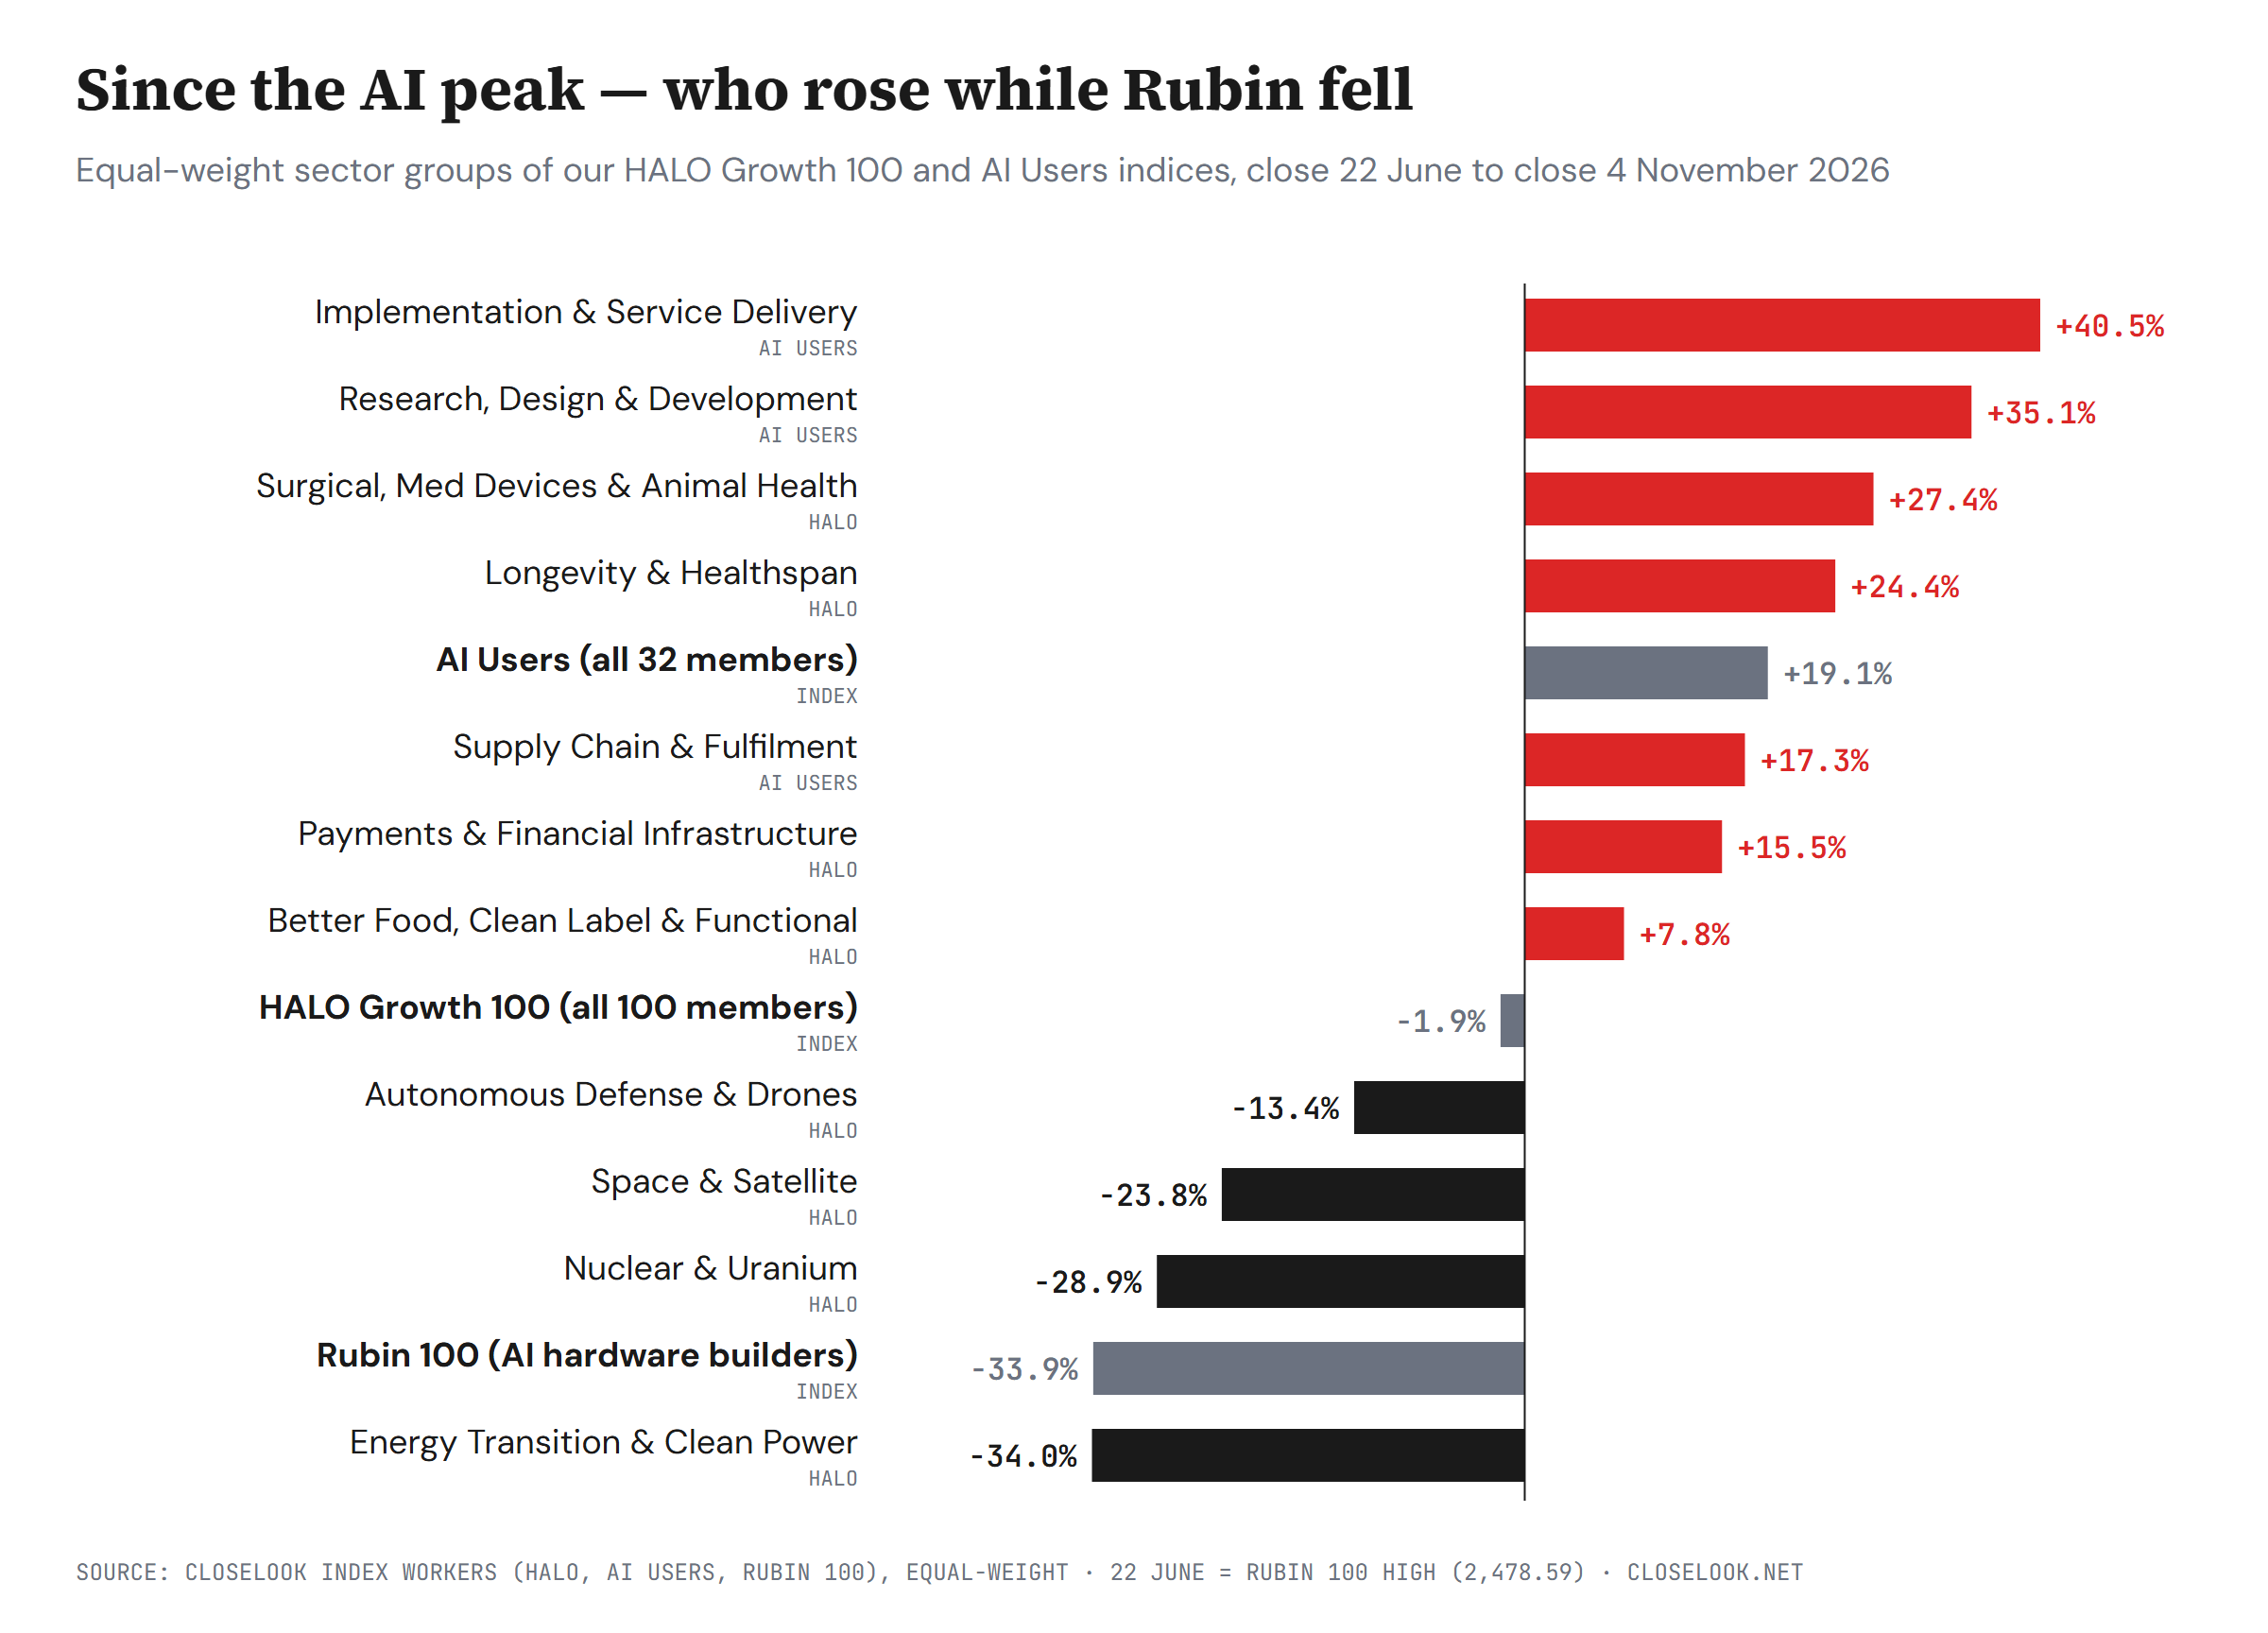
- ACN it-services-group-up-40-5-percent-since-ai-peak BULLISH
- ISRG med-devices-group-record-close-up-9-4-percent-wednesday BULLISH
- CME exchanges-lead-payments-group-up-14-1-percent-in-a-month BULLISH
- CCJ nuclear-group-down-28-9-percent-since-ai-peak BEARISH
The AI trade has been fading since 22 June. On that day the Rubin 100, our index of the companies that build AI hardware, closed at its high of 2,478.59; on Wednesday it closed at 1,638.05, 33.9% lower, and this morning Asia sold its chip makers again. If the fade runs longer, the question is where money goes instead. Our two indices outside AI hardware — HALO Growth 100 and AI Users — have already answered part of it: health care, IT services, exchanges and everyday consumer names have risen through the fade. Power, space and the fastest growers have fallen with Rubin.
Rubin's 40 worst days — who rose anyway
The period since June is one stretch. A harder test is the single day. This year the Rubin 100 fell 2% or more on 40 sessions, on average by 4.06%. On those days IT services rose 31 times and food companies 29 times. Nuclear rose on 5 of them and space on 4.
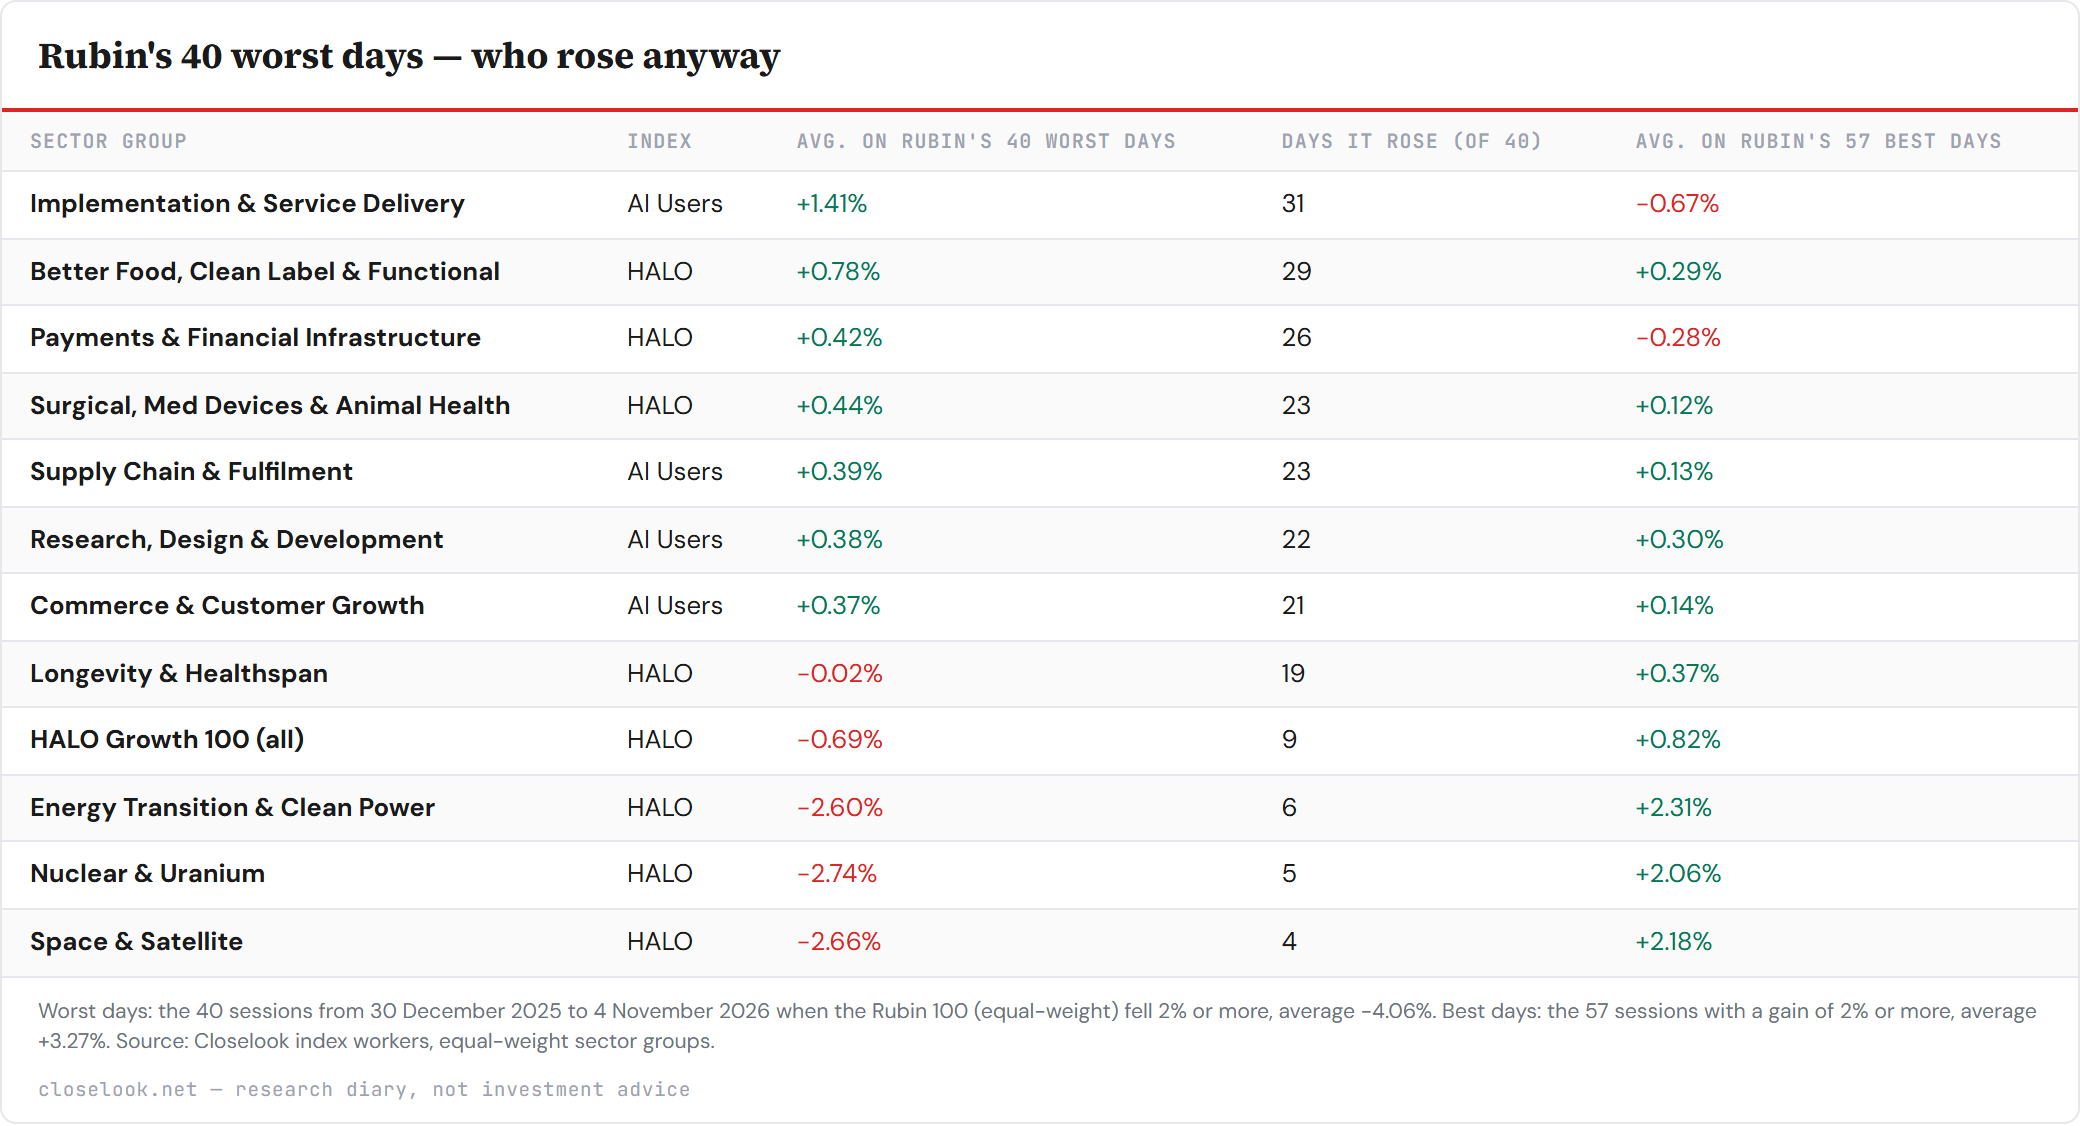
Table as text
| Sector group | Index | Avg. on Rubin's 40 worst days | Days it rose (of 40) | Avg. on Rubin's 57 best days |
|---|---|---|---|---|
| Implementation & Service Delivery | AI Users | +1.41% | 31 | −0.67% |
| Better Food, Clean Label & Functional | HALO | +0.78% | 29 | +0.29% |
| Payments & Financial Infrastructure | HALO | +0.42% | 26 | −0.28% |
| Surgical, Med Devices & Animal Health | HALO | +0.44% | 23 | +0.12% |
| Supply Chain & Fulfilment | AI Users | +0.39% | 23 | +0.13% |
| Research, Design & Development | AI Users | +0.38% | 22 | +0.30% |
| Commerce & Customer Growth | AI Users | +0.37% | 21 | +0.14% |
| Longevity & Healthspan | HALO | −0.02% | 19 | +0.37% |
| HALO Growth 100 (all) | HALO | −0.69% | 9 | +0.82% |
| Energy Transition & Clean Power | HALO | −2.60% | 6 | +2.31% |
| Nuclear & Uranium | HALO | −2.74% | 5 | +2.06% |
| Space & Satellite | HALO | −2.66% | 4 | +2.18% |
Worst days: the 40 sessions from 30 December 2025 to 4 November 2026 when the Rubin 100 (equal-weight) fell 2% or more, average −4.06%. Best days: the 57 sessions with a gain of 2% or more, average +3.27%. Source: Closelook index workers, equal-weight sector groups.
C — free account
The free C account unlocks the full Daily Pulse — every section of this read.
One tap with Google or one email — no password, no card. You are signed in until you sign out, on this browser, from then on.
Join the Look — freeAlready joined on this browser? The full edition shows automatically — if it doesn't, sign in again here. Looking for the archive, portfolios and realtime? That is C+.
One more block on our desk — tomorrow's levels and what we're watching into the next session. Join the Look — it’s free.