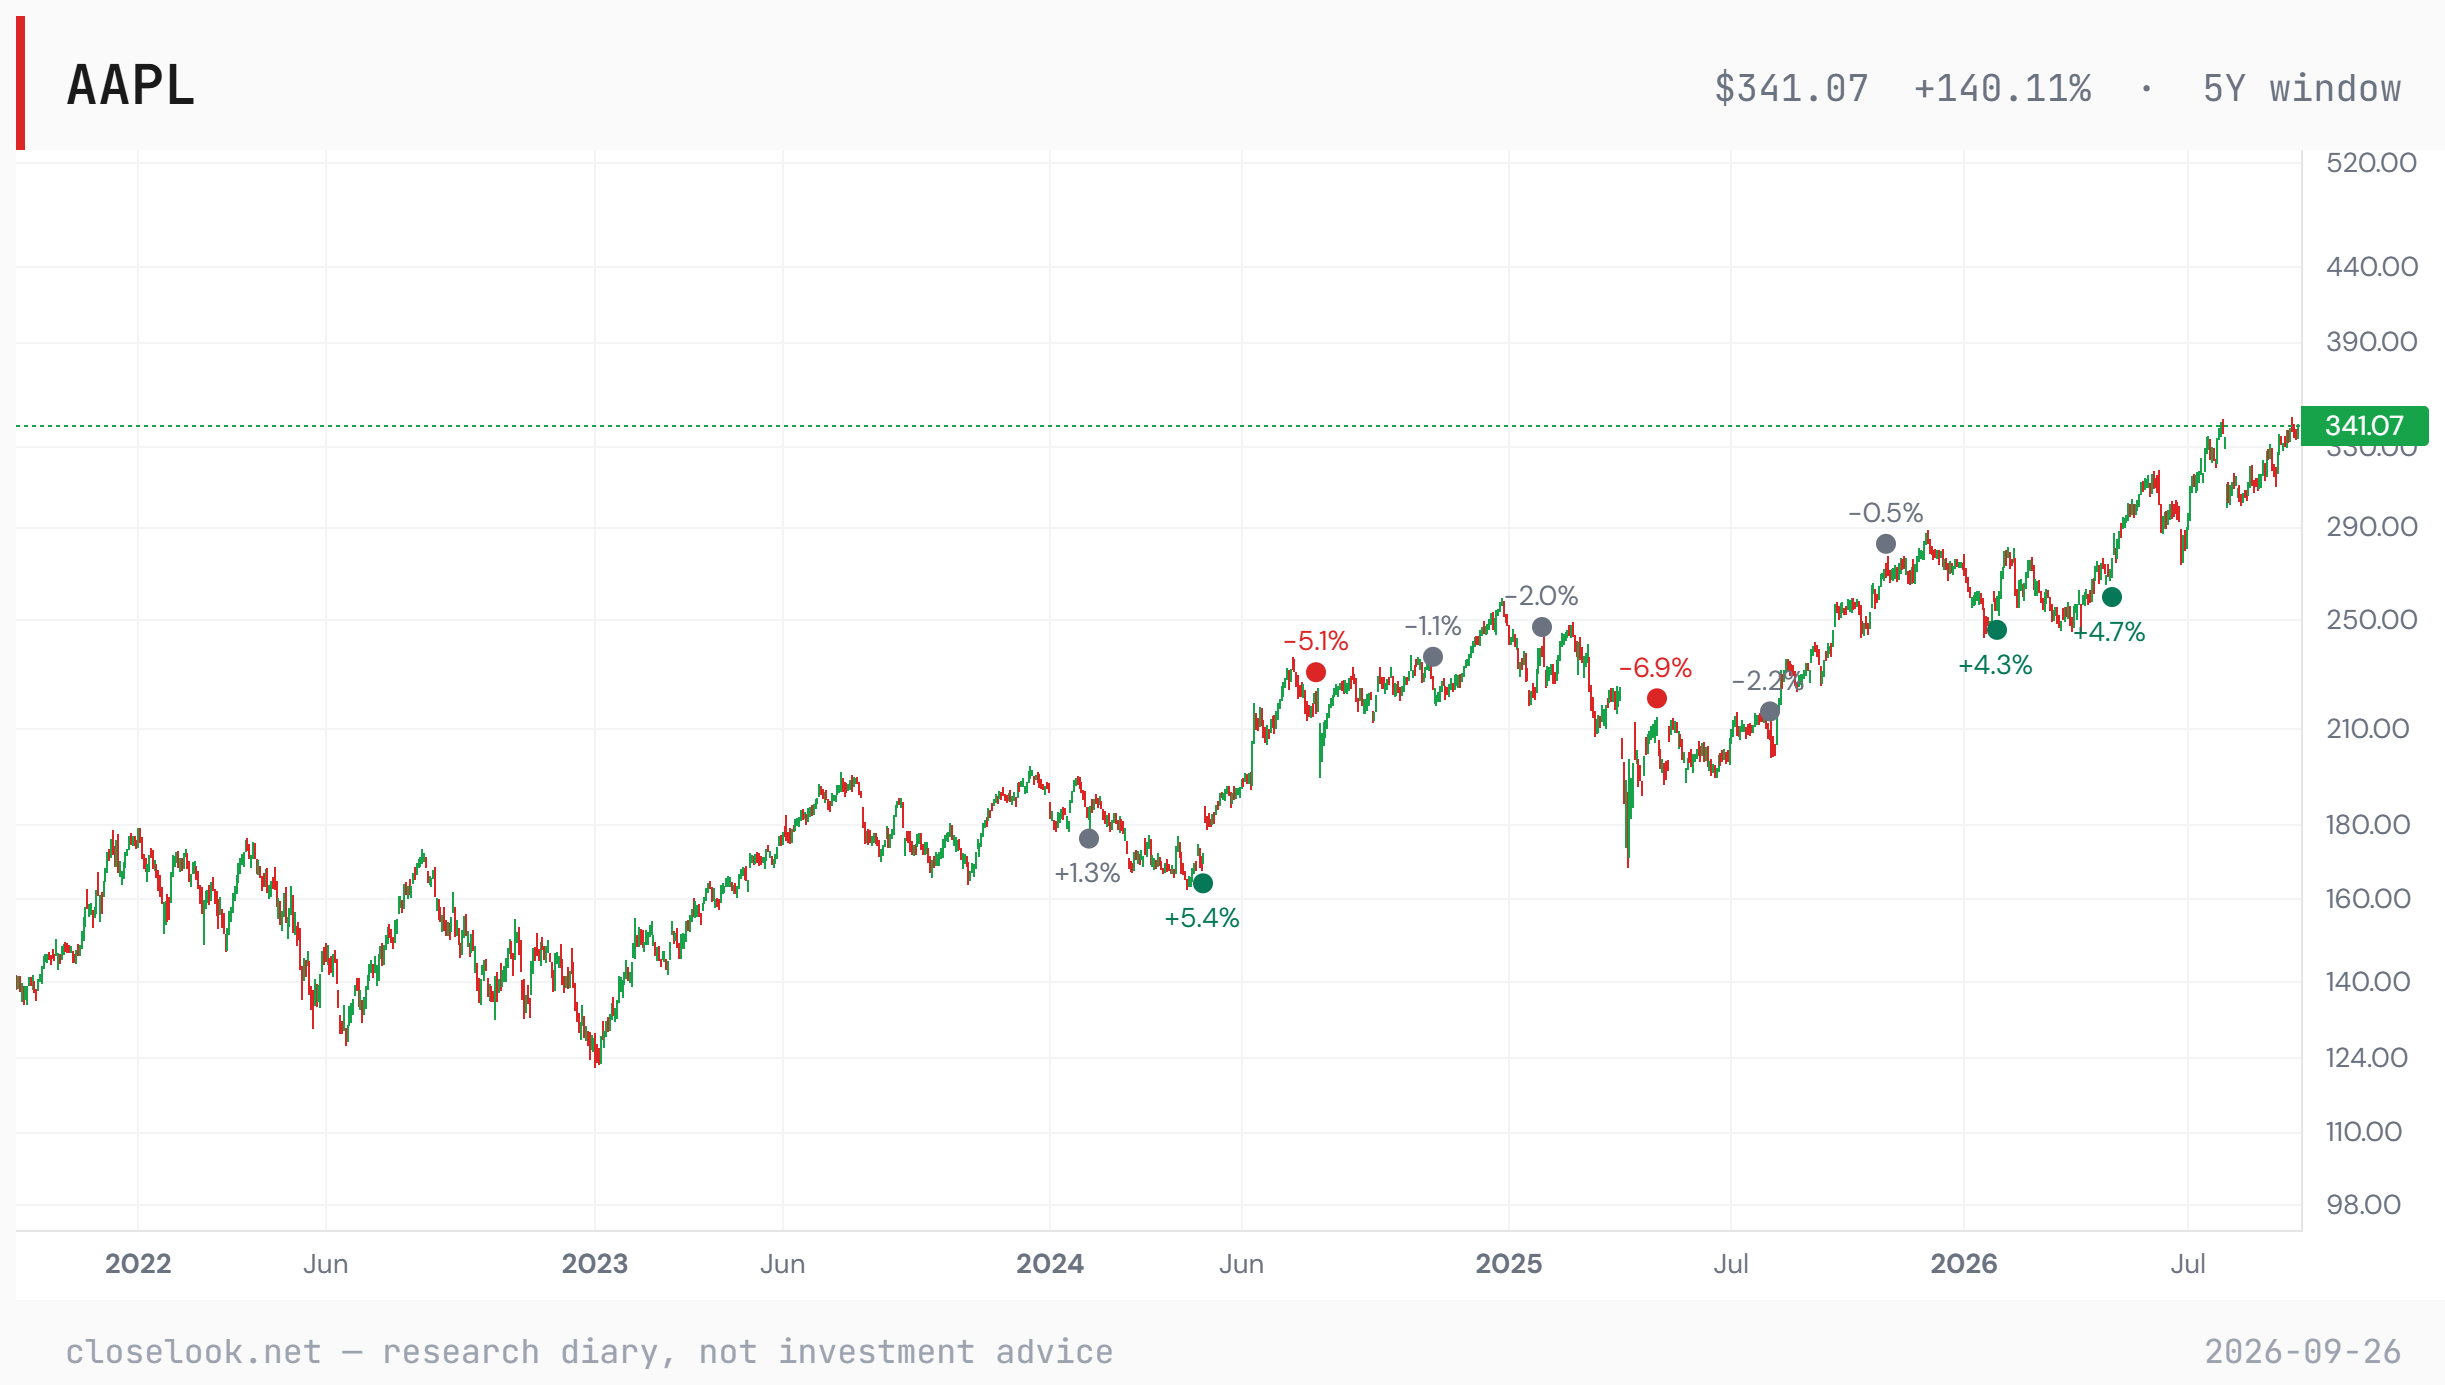
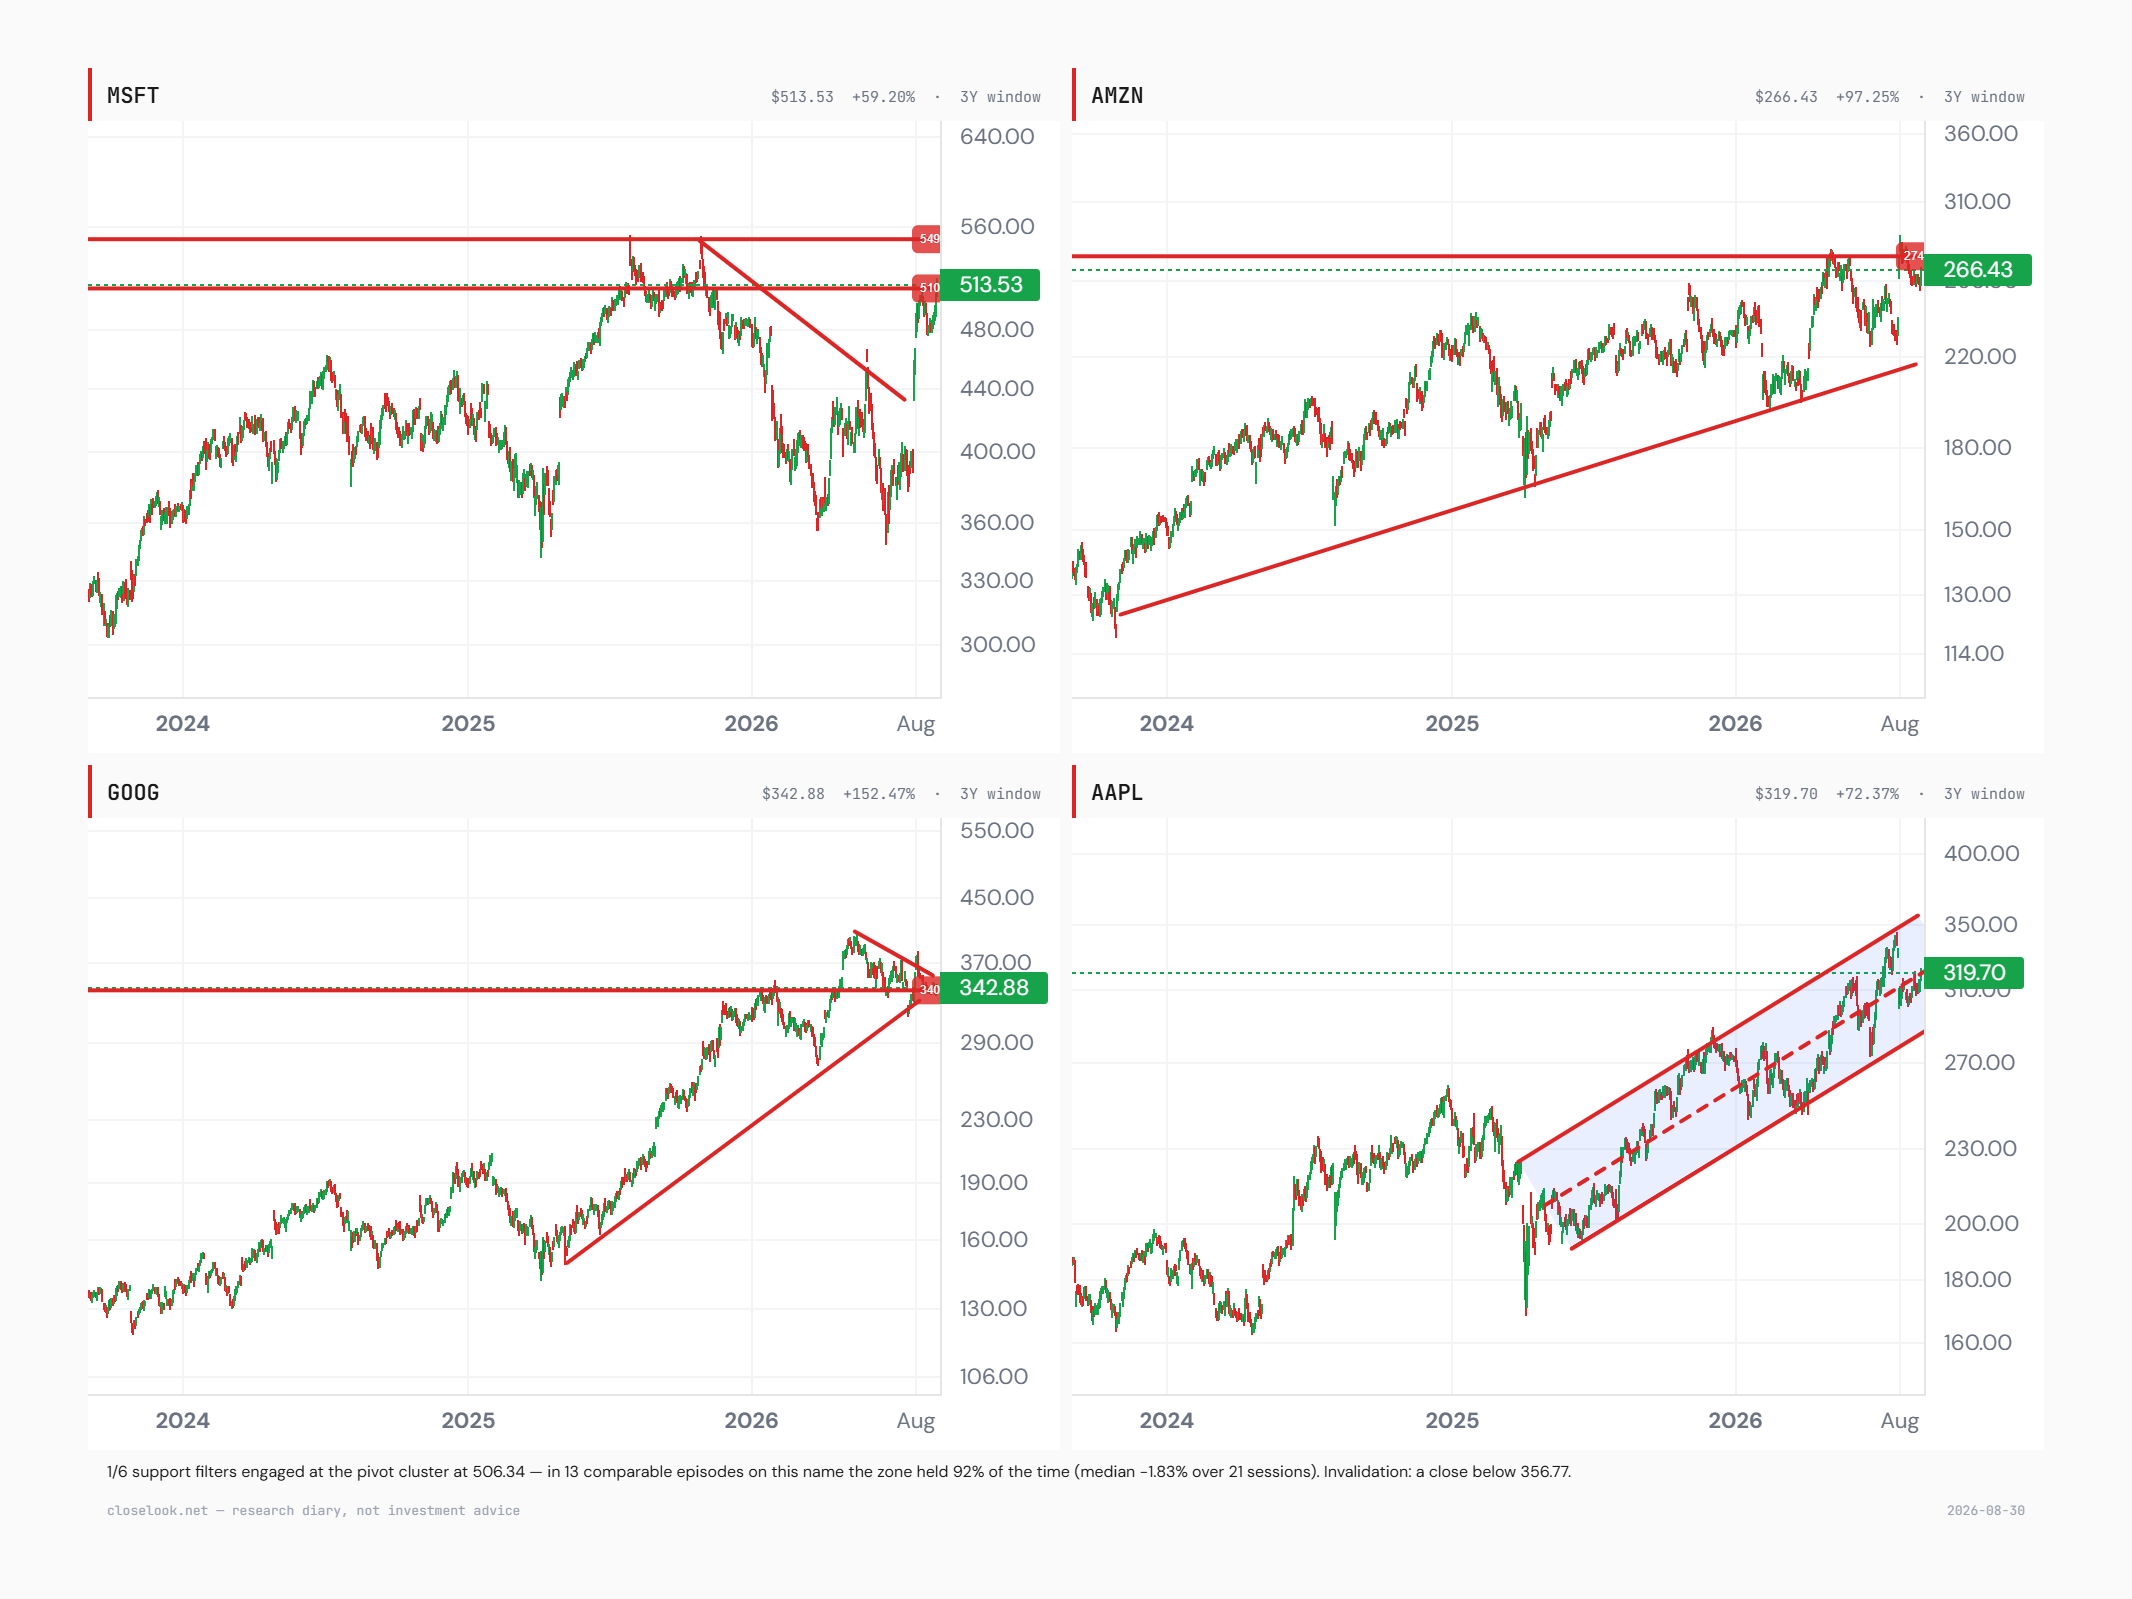
What is Apple Inc. (AAPL)?
Apple Inc. trades as AAPL on the US exchange (US) and is classified under Technology in the Closelooknet research universe, as of the registry build of 2026-11-11.
Is AAPL in a Closelooknet index?
Yes — Apple Inc. is a constituent of Agentic Winners 40, as of 2026-11-11.
What is Apple Inc.'s Closelooknet composite score?
57 out of 100, with momentum 87, quality 83 and valuation 21 sub-scores, as of 2026-11-11. Scores are Closelooknet's own research readings, not ratings or investment advice.
What is Apple Inc.'s earnings print record?
Across the 11 prints Closelooknet covers, Apple Inc. beat EPS estimates 11 times and revenue estimates 11 times; the three-day reactions split 3 up, 5 flat and 3 down (moves beyond ±3%), as of the 2026-10-22 card. The full print-record card carries the per-print history.
Where does AAPL trade against its moving averages?
Apple Inc. trades 4.2% above its 50-day and 17.2% above its 200-day moving average (2.0% above its 20-day). As of 2026-11-09 — a technical state from the nightly Closelooknet bake, not advice. The Technical tab carries the full row.
How is AAPL doing against its Closelooknet index?
Over the past month Apple Inc. is +2.2% against −2.1% for the Agentic Winners 40 — 4.3 points ahead of its index, as of 2026-11-10. Its Megacap Gateway sleeve is −8.6% over the same month. The “Versus its index” table on this page carries the day, the week and the month for the name, its sleeve and the index.
How does Apple Inc. compare with its peers?
Against its peer group (Devices and consumer platforms), Apple Inc. (AAPL) sits 1.3% below its 52-week high, 4.2% above its 50-day average; Samsung Electronics Co Ltd (005930.KS) is 46.9% below, Alphabet Inc Class A (GOOGL) is 29.5% below, Microsoft Corporation (MSFT) is 2.5% below, as of 2026-11-09. Put any of them next to AAPL in the chart grid (2×1 or 2×2) and the page lays the companies side by side: performance, trend, valuation, margins and our money-flow reading.
How does Apple Inc. trade when bond yields rise?
Over the past year Apple Inc. had a beta of 0.40 to TLT, the long-dated Treasury fund — it tends to move with bonds, higher than 29% of US names. On the 10 sessions in which long bonds fell most it moved −0.13% on average, against −0.72% for the S&P 500. As of 2026-11-10; The "How it trades on rate days" block on this page carries the lines.
Does Closelooknet hold Apple Inc.?
Yes — AI Cycle 2030 (wikifolio): 6 shares · average entry €296.30 (book of 2026-11-10). A record of what the diary does, not a recommendation to do the same.
What does Apple Inc. do?
Apple designs and sells iPhone, Mac, iPad and wearables, and runs services such as the App Store, Apple Music and Apple Pay. It serves consumers, businesses, education, enterprise and government customers worldwide, selling through its own stores, a direct sales force and third-party carriers. Closelooknet's peer group prices Apple against devices and consumer-platform names — Samsung Electronics, Alphabet, Microsoft, Dell and HP — reflecting shared hardware and services markets rather than shared sector labels alone. (Company snapshot of 2026-09-17.)
Where does Apple Inc. sit in the AI build-out?
Apple holds no seat in Rubin, our AI build-out index. Within the diary's universe it sits in the Technology sector, in the consumer electronics industry, as a devices and platform name rather than a build-out constituent. Apple sits in Closelooknet's Agentic Winners 40, the Nasdaq-100 and the Dow Jones Industrial Average, and carries a Closelooknet score in which the quality module reads strongest and the valuation module reads weakest. The diary has quoted it in dossiers on agentic winners and on the Nvidia analogy chain, and in a Weekly Signal on the Magnificent Seven. (Company snapshot of 2026-09-17.)
Does Apple Inc. pay a dividend?
Apple Inc. has paid 1.06 USD per share over the last twelve months, paid quarterly, a trailing yield of 0.30% on the 2026-11-10 close; the last distribution recorded in the price series was 0.27 USD on 2026-08-10. In fiscal 2026 the company paid 15.7 bn USD in dividends and bought back 86.4 bn USD of its own shares, 75% of that year’s free cash flow. The share count fell 1.9% over the fiscal year. As of 2026-11-10; the "Dividends and capital return" block on this page carries the lines.
What has Wall Street done on Apple Inc. recently?
The most recent analyst action on Apple Inc. on the Closelooknet wire is a price target by Bernstein SocGen Group on 2026-11-04 (target 380). 10 actions on the analyst wire since 2026-08-13: 1 upgrade, 1 downgrade, 1 initiation, 7 target changes. Its latest earnings print on the wire, 2026-11-02: EPS 2.05 against 1.99 expected — a +3.0% beat. Analyst actions are third-party opinions recorded by the wire, not Closelooknet readings. The “The Street on this name” block on this page lists the moves; the full feeds are the analyst wire and the earnings wire.
What does this page show?
A live price chart with SMA overlays and drawing tools for AAPL, performance metrics, index-membership context and the Closelooknet structure read — an investment research diary view, not investment advice.