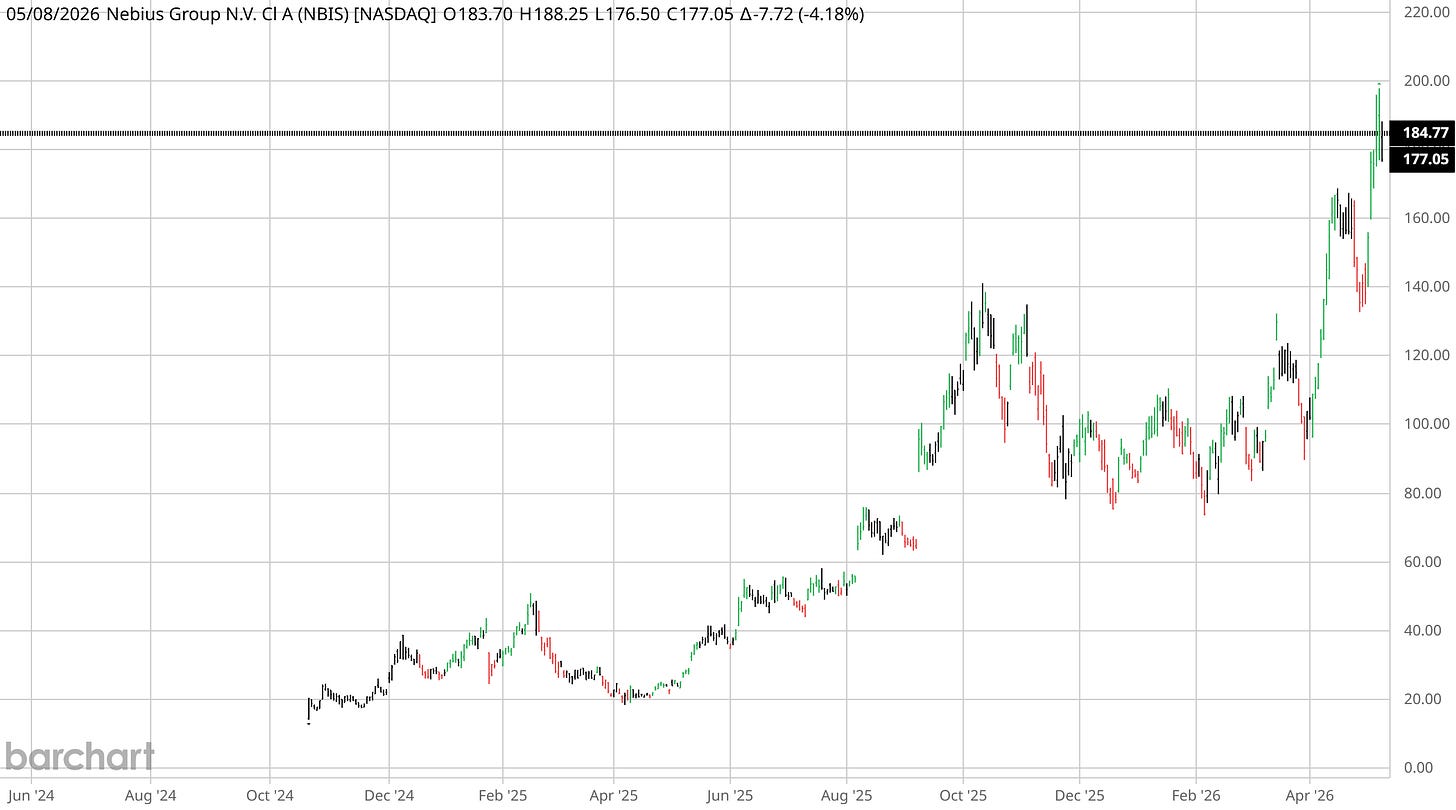
What is Nebius Group N.V. (NBIS)?
Nebius Group N.V. trades as NBIS on the US exchange and is classified under Communication Services in the Closelooknet research universe, as of the registry build of 2026-11-11.
Is NBIS in a Closelooknet index?
Yes — Nebius Group N.V. is a constituent of Euro-AI 50, as of 2026-11-11.
What is Nebius Group N.V.'s Closelooknet composite score?
42 out of 100, with momentum 32, quality 20 and valuation 23 sub-scores, as of 2026-11-11. Scores are Closelooknet's own research readings, not ratings or investment advice.
What is Nebius Group N.V.'s earnings print record?
Across the 8 prints Closelooknet covers, Nebius Group N.V. beat EPS estimates 5 times and revenue estimates 3 times; the three-day reactions split 3 up, 1 flat and 4 down (moves beyond ±3%), as of the 2026-08-11 card. The full print-record card carries the per-print history.
What is the current Closelooknet signal-board read on NBIS?
Down 5.3% at the close — Already below its 50-day; one of the day's sharpest drops. As of 2026-11-10; the signal board re-bakes nightly. A structure reading from Closelooknet's research diary, not advice.
Where does NBIS trade against its moving averages?
Nebius Group N.V. trades 29.4% below its 50-day and 20.8% below its 200-day moving average (12.6% below its 20-day). As of 2026-11-09 — a technical state from the nightly Closelooknet bake, not advice. The Technical tab carries the full row.
How is NBIS doing against its Closelooknet index?
Over the past month Nebius Group N.V. is −36.2% against −18.1% for the Agentic Ecosystem Index — 18.1 points behind its index, as of 2026-11-10. Its Compute Operators sleeve is −25.0% over the same month. The “Versus its index” table on this page carries the day, the week and the month for the name, its sleeve and the index.
How does Nebius Group N.V. compare with its peers?
Against its peer group (Neoclouds and GPU renters), Nebius Group N.V. (NBIS) sits 52.8% below its 52-week high, 29.4% below its 50-day average; CoreWeave, Inc. Class A Common Stock (CRWV) is 67.7% below, IREN Ltd (IREN) is 71.3% below, Oracle Corporation (ORCL) is 63.2% below, as of 2026-11-09. Put any of them next to NBIS in the chart grid (2×1 or 2×2) and the page lays the companies side by side: performance, trend, valuation, margins and our money-flow reading.
How does Nebius Group N.V. trade when bond yields rise?
Over the past year Nebius Group N.V. had a beta of −0.09 to TLT, the long-dated Treasury fund — it shows only a loose link to bond moves, higher than 7% of US names. On the 10 sessions in which long bonds fell most it moved +0.05% on average, against −0.72% for the S&P 500. As of 2026-11-10; The "How it trades on rate days" block on this page carries the lines.
Does Closelooknet hold Nebius Group N.V.?
Yes — Global Tech 50: 100 shares · average entry $89.96, +49.0% unrealised (book of 2026-11-10); AI Buildout: 75 shares · average entry $98.02, +36.7% unrealised (book of 2026-11-10); Hypergrowth: 200 shares · average entry $126.56, +5.9% unrealised (book of 2026-11-10); Hypergrowth: short 2 calls · $200 strike · 21 Jan 2028 · sold at $36.92, now $37.40, -1.3% unrealised (book of 2026-11-10); Derivatives: short 1 put · $160 strike · 17 Jun 2027 · sold at $34.44, now $54.40 since 2026-05-27, -58.0% unrealised (book of 2026-11-10); AI Cycle 2030 (wikifolio): 12 shares · average entry €159.57 (book of 2026-11-10). A record of what the diary does, not a recommendation to do the same.
What does Nebius Group N.V. do?
Nebius builds infrastructure for AI workloads, running large GPU clusters and a cloud platform with developer tools for training and deploying models. It also owns TripleTen, an education service for technology careers, and Avride, which works on self-driving cars and delivery robots. The company has a partnership with Nvidia to expand its AI cloud capacity, and is based in the Netherlands after a rename from its former identity. Closelooknet's peer group for Nebius is neoclouds and GPU renters, the firms the market prices it against rather than plain sector peers: CoreWeave, IREN, Oracle and Applied Digital. A wider comparison the market draws is with the large cloud providers such as Microsoft Azure. (Company snapshot of 2026-09-17.)
Where does Nebius Group N.V. sit in the AI build-out?
Nebius carries no seat in our Rubin index, so it sits in the diary's neocloud and GPU-rental sleeve, alongside firms that rent out AI compute rather than design or fabricate chips. Inside that sleeve it is a customer of the chip and equipment layers, buying GPUs to resell as cloud capacity to model builders. Nebius holds a seat in our Euro-AI 50 index and carries a Closelooknet score, with momentum its strongest module and quality its weakest. The diary has quoted it across a Dossier on orchestration infrastructure, a Heresy piece on portfolio construction, and a Report tracking Nvidia-linked investment patterns. (Company snapshot of 2026-09-17.)
Does Nebius Group N.V. pay a dividend?
No cash distribution shows in Nebius Group N.V.’s price series over the last three years. The share count fell 9.9% over the fiscal year. As of 2026-11-10; the "Dividends and capital return" block on this page carries the lines.
What has Wall Street done on Nebius Group N.V. recently?
The most recent analyst action on Nebius Group N.V. on the Closelooknet wire is a price target by Piper Sandler on 2026-10-21 (target 185 from 237). 6 actions on the analyst wire since 2026-08-13: 1 initiation, 5 target changes. Analyst actions are third-party opinions recorded by the wire, not Closelooknet readings. The “The Street on this name” block on this page lists the moves; the full feeds are the analyst wire and the earnings wire.
What does this page show?
A live price chart with SMA overlays and drawing tools for NBIS, performance metrics, index-membership context and the Closelooknet structure read — an investment research diary view, not investment advice.