—

Space Exploration Technologies Corp. Class A Common Stock (SPCX) — chart, structure and Closelooknet read

The Closelooknet read

SpaceX operates through three segments: Space, Connectivity and AI. The Space segment builds and launches reusable rockets, including Falcon 9, Falcon Heavy, Starship and Dragon, carrying commercial and government payloads.

Detail below: the desk's view, the earnings record, peers and the company snapshot; daily prices on the price-history tab. Agents can buy the score depth per call over HTTP 402 — see the catalogue. Research diary readings, not advice.

Pick a ticker to load its detail page.

The desk on SPCX

What this diary said about Space Exploration Technologies Corp. Class A Common Stock, what it holds and what would change its view — in its own words, dated. Investment diary, not advice.

What we said

What we hold

BookPositionSinceResult
Hypergrowth 100 shares · average entry $144.72 — −1.1%
Hypergrowth short 1 call · $175 strike · 21 Jan 2028 · sold at $21.18, now $23.40 — −10.5%

Model books as of 10 Nov 2026; wikifolio positions from the official wikifolio data, entries in euros. Results are unrealised, before any exit. A record of what the diary does, not a recommendation to do the same.

Charts from the desk on SPCX

The charts this diary drew or picked on Space Exploration Technologies Corp. Class A Common Stock, as published — each dated and linked to the piece that explains it.

Signals for this name

Every Closelooknet reading that exists for SPCX, from the same nightly bakes the boards use. Research diary readings, not advice.

Versus its index Rubin Build-Out 100 · Agentic Ecosystem Index — the name, its sleeve and the index over day, week and month

Versus its index

The name against its Closelooknet index and its own sleeve — equal-weight, nightly closes.

Rubin Build-Out 100 · as of 2026-11-10

DayWeekMonth3 months
SPCX+0.7%+1.3%−12.4%−2.1%
High-Speed Interconnects−1.2%−7.8%−30.1%—
Rubin Build-Out 100+1.4%−7.1%−22.2%—

Against the index: 8.4 pts ahead on the week, 9.8 pts ahead on the month; against its High-Speed Interconnects sleeve 17.7 pts ahead on the month.

Agentic Ecosystem Index · as of 2026-11-10

DayWeekMonth3 months
SPCX+0.7%+1.3%−12.4%−2.1%
Edge & Distribution+1.9%−1.7%−15.9%—
Agentic Ecosystem Index0.0%−2.8%−18.1%—

Against the index: 4.1 pts ahead on the week, 5.7 pts ahead on the month; against its Edge & Distribution sleeve 3.5 pts ahead on the month.

Returns from the index workers’ nightly closes; equal-weight sleeves. A relative reading from the research diary, not advice.

Mentioned on Closelooknet 9 pieces · newest: Midday 10, “Chips — Up 6% Without Nvidia: AMD Jumps 11%, Broadcom 8%, Nvidia Slides 6%” (2026-11-09)

Mentioned on Closelooknet

Where SPCX appears in the diary — 9 pieces, newest first. Every link is our own writing.

Long reads

Dailies

Weather around the name 4 macro readings: Money Temperature, Factor regime, Sector × region …

The weather around this name

Macro readings that apply by membership — the regime, the factor tape, the sector cell, the funding backdrop.

  • Money Temperature Composite 48/100 · S&P 500 fund at 51, above its 200-day averageEight instruments scored on position, momentum, volume, volatility and fragility — the regime every name trades inside. Temperature lab → 2026-11-10
  • Factor regime Defensive rotation — low-vol leading, regime-change watchMomentum against low volatility (SPMO / SPLV): below its 50-day trend, 67th percentile of the window, -18.1% over 20 sessions. Factor regime → 2026-11-10
  • Sector × region Industrials in US: −1.5% week · −0.2% month · −9.0% quarter · −1.7% yearThe Sector Engine cell this name lives in, from XLI.US; the 11 × 4 matrix shows where its sector is being bought and where it is being sold. Sector Engine → 2026-11-10
  • Sovereign pressure Index -1.67 · down 1.71 over 21 sessionsG7 long-end yields, 10s30s and the slope — the funding weather for every balance sheet on this site. Sovereign pressure → 2026-11-09
Who it is priced against Rubin Build-Out 100 · High-Speed Interconnects · 8 names with week and year-to-date

Optical transceivers, switching silicon, networking IP. The fabric that turns isolated GPUs into clusters.

Compared against SPCX on the nightly bakes; the Peers tab ranks the cohort on the Closelooknet scores where it exists.

Company snapshot — Space Exploration Technologies Corp. Class A Common Stock

SPCX in five paragraphs: what it makes and sells, where it sits in the Closelooknet stack, who it is priced against, why we track it, what we watch. Research diary, not advice.

What it does
SpaceX operates through three segments: Space, Connectivity and AI. The Space segment builds and launches reusable rockets, including Falcon 9, Falcon Heavy, Starship and Dragon, carrying commercial and government payloads. The Connectivity segment runs the Starlink satellite network, selling broadband to consumers, businesses and governments. The AI segment covers the Grok large language model, AI tools for consumers and enterprises, the X platform, and the computing infrastructure behind them. It is based in Starbase, Texas, and listed in June.
Where it sits in the stack
In our index, SpaceX sits in Layer 5, Connectivity & Materials, inside the High-Speed Interconnects sleeve — the fabric that links separate GPUs into working clusters. Here it counts as a customer of that fabric: its Starlink network and its AI computing arm both depend on the optical and switching gear this sleeve makes.
Who it is priced against
Closelooknet's peer group places it with the High-Speed Interconnects names — Credo, Amphenol, Astera Labs, Lumentum, Marvell, MACOM, Nokia and Coherent — reasoning that they all build or use the fabric linking GPUs into clusters; in satellite broadband the market's usual comparison is Amazon's Kuiper project.
Why Closelooknet tracks it
SpaceX holds seats in the Agentic Ecosystem Index and the Rubin Build-Out 100, and carries a Closelooknet score with momentum as its strongest module and valuation as its weakest. The diary named it in a Weekly Signal piece on newly listed names and in a Morning 10 note on a post-earnings session.
What the diary watches
Whether the AI segment's computing build keeps drawing on the same interconnect names as the rest of the sleeve, and whether the gap between its momentum and its valuation reading narrows.

Space Exploration Technologies Corp. Class A Common Stock (SPCX) trades on US exchanges, classified under Industrials, and sits in Layer 5 of the build-out stack. Constituent of Agentic Ecosystem Index and Rubin Build-Out 100.

The Closelooknet company score reads 39/100 composite (momentum 55, quality 21, valuation 6) across 7 modules — the full breakdown, chart structure and analog history load live above.

Written from the company’s public profile and Closelooknet’s own readings, 2026-09-17. Descriptive, refreshed with the registry; corrections welcome via the imprint. closelook.net is an investment research diary — market structure, index membership and scores are our own readings, not investment advice. Related: index compare · sector dispersion · scanner.

The Street on this name 13 analyst actions on the wire · latest: price target by Bernstein, 2026-10-26 · last print 2026-10-20

The Street on this name

Analyst actions and the latest print for SPCX from the Closelooknet wires — third-party opinions on the record, not our readings.

  • Price target Bernstein — target 267 from 248 Target raised to $267 from $248 (+81% to spot) 2026-10-26
  • Price target Bernstein SocGen Group — target 268 Target set to $268 (+81.7% to spot) 2026-10-26
  • Price target Pivotal Research — target 260 Target set to $260 (+60.3% to spot) 2026-10-21
  • Latest print EPS 0.35 against 0.13 expected — a +161.4% beat 2026-10-20

13 actions on the analyst wire since 2026-08-13: 1 initiation, 12 target changes. Analyst wire → · Earnings wire →

Dividends and capital return no distribution in twelve months · buybacks 1.13 bn USD in FY2025

Dividends and capital return

What SPCX pays out and buys back — distributions read from the price series, money terms from the filings.

  • Distributions No cash distribution recorded in the price series over the last three years
  • Buybacks, FY2025 1.13 bn USD 0.1% of today's market value
  • Share count +6.7% in FY2025 1.95 bn USD of stock-based compensation in the year
  • Capital returned 1.13 bn USD in a year of negative free cash flow dividends and buybacks together

Per-share amounts are derived from the adjusted price series in the listing currency, so dates sit within days of the ex-date; filing figures come from the fundamentals feed for the last reported fiscal year. An investment diary, not a recommendation.

FAQ · from the current data · as of 2026-11-11

Quick answers

What is Space Exploration Technologies Corp. Class A Common Stock (SPCX)?

Space Exploration Technologies Corp. Class A Common Stock trades as SPCX on the US exchange (US) and is classified under Industrials in the Closelooknet research universe, as of the registry build of 2026-11-11.

Is SPCX in a Closelooknet index?

Yes — Space Exploration Technologies Corp. Class A Common Stock is a constituent of Agentic Ecosystem Index and Rubin Build-Out 100, as of 2026-11-11.

What is Space Exploration Technologies Corp. Class A Common Stock's Closelooknet composite score?

39 out of 100, with momentum 55, quality 21 and valuation 6 sub-scores, as of 2026-11-11. Scores are Closelooknet's own research readings, not ratings or investment advice.

Where does SPCX trade against its moving averages?

Space Exploration Technologies Corp. Class A Common Stock trades 4.8% below its 50-day and 2.4% below its 200-day moving average (1.5% below its 20-day). As of 2026-11-09 — a technical state from the nightly Closelooknet bake, not advice. The Technical tab carries the full row.

How is SPCX doing against its Closelooknet index?

Over the past month Space Exploration Technologies Corp. Class A Common Stock is −12.4% against −22.2% for the Rubin Build-Out 100 — 9.8 points ahead of its index, as of 2026-11-10. Its High-Speed Interconnects sleeve is −30.1% over the same month. The “Versus its index” table on this page carries the day, the week and the month for the name, its sleeve and the index.

How does Space Exploration Technologies Corp. Class A Common Stock compare with its peers?

Against its peer group (Rubin Build-Out 100 · High-Speed Interconnects), Space Exploration Technologies Corp. Class A Common Stock (SPCX) sits 37.0% below its 52-week high, 4.8% below its 50-day average; Amphenol Corporation (APH) is 10.3% below, Astera Labs, Inc. (ALAB) is 56.6% below, Lumentum Holdings Inc (LITE) is 47.8% below, as of 2026-11-09. Put any of them next to SPCX in the chart grid (2×1 or 2×2) and the page lays the companies side by side: performance, trend, valuation, margins and our money-flow reading.

Where has Closelooknet written about Space Exploration Technologies Corp. Class A Common Stock?

Space Exploration Technologies Corp. Class A Common Stock appears in 9 Closelooknet pieces as of 2026-11-11, most recently Midday 10: Chips — Up 6% Without Nvidia: AMD Jumps 11%, Broadcom 8%, Nvidia Slides 6% (2026-11-09); Midday 10: AI Builders — Chips Bounce 4%, AMD Jumps 10% and IREN 20% After a Strong Jobs Report (2026-11-06); Midday 10: Chips — SOXX −3.7%, now 20% below its June high; software −2.4% as hot inflation and BlackRock weigh (2026-10-14). What Closelooknet said most recently: The desk's T1 Index, the equal-weight basket of every stock that has ever closed at or above one trillion dollars, has been rebuilt this afternoon to admit AMD from 21 September and SpaceX — listed as SPCX on 12 June at roughly $2.1… (Midday 10, 2026-09-22). The "Mentioned on Closelooknet" block on this page lists the long reads, the reference entries and the dailies that name it.

Does Closelooknet hold Space Exploration Technologies Corp. Class A Common Stock?

Yes — Hypergrowth: 100 shares · average entry $144.72, -1.1% unrealised (book of 2026-11-10); Hypergrowth: short 1 call · $175 strike · 21 Jan 2028 · sold at $21.18, now $23.40, -10.5% unrealised (book of 2026-11-10). A record of what the diary does, not a recommendation to do the same.

What does Space Exploration Technologies Corp. Class A Common Stock do?

SpaceX operates through three segments: Space, Connectivity and AI. The Space segment builds and launches reusable rockets, including Falcon 9, Falcon Heavy, Starship and Dragon, carrying commercial and government payloads. The Connectivity segment runs the Starlink satellite network, selling broadband to consumers, businesses and governments. Closelooknet's peer group places it with the High-Speed Interconnects names — Credo, Amphenol, Astera Labs, Lumentum, Marvell, MACOM, Nokia and Coherent — reasoning that they all build or use the fabric linking GPUs into clusters; in satellite broadband the market's usual comparison is Amazon's Kuiper project. (Company snapshot of 2026-09-17.)

Where does Space Exploration Technologies Corp. Class A Common Stock sit in the AI build-out?

In our index, SpaceX sits in Layer 5, Connectivity & Materials, inside the High-Speed Interconnects sleeve — the fabric that links separate GPUs into working clusters. Here it counts as a customer of that fabric: its Starlink network and its AI computing arm both depend on the optical and switching gear this sleeve makes. SpaceX holds seats in the Agentic Ecosystem Index and the Rubin Build-Out 100, and carries a Closelooknet score with momentum as its strongest module and valuation as its weakest. The diary named it in a Weekly Signal piece on newly listed names and in a Morning 10 note on a post-earnings session. (Company snapshot of 2026-09-17.)

Does Space Exploration Technologies Corp. Class A Common Stock pay a dividend?

No cash distribution shows in Space Exploration Technologies Corp. Class A Common Stock’s price series over the last three years. In fiscal 2025 the company bought back 1.13 bn USD of its own shares. The share count rose 6.7% over the fiscal year. As of 2026-11-10; the "Dividends and capital return" block on this page carries the lines.

What has Wall Street done on Space Exploration Technologies Corp. Class A Common Stock recently?

The most recent analyst action on Space Exploration Technologies Corp. Class A Common Stock on the Closelooknet wire is a price target by Bernstein on 2026-10-26 (target 267 from 248). 13 actions on the analyst wire since 2026-08-13: 1 initiation, 12 target changes. Its latest earnings print on the wire, 2026-10-20: EPS 0.35 against 0.13 expected — a +161.4% beat. Analyst actions are third-party opinions recorded by the wire, not Closelooknet readings. The “The Street on this name” block on this page lists the moves; the full feeds are the analyst wire and the earnings wire.

What does this page show?

A live price chart with SMA overlays and drawing tools for SPCX, performance metrics, index-membership context and the Closelooknet structure read — an investment research diary view, not investment advice.
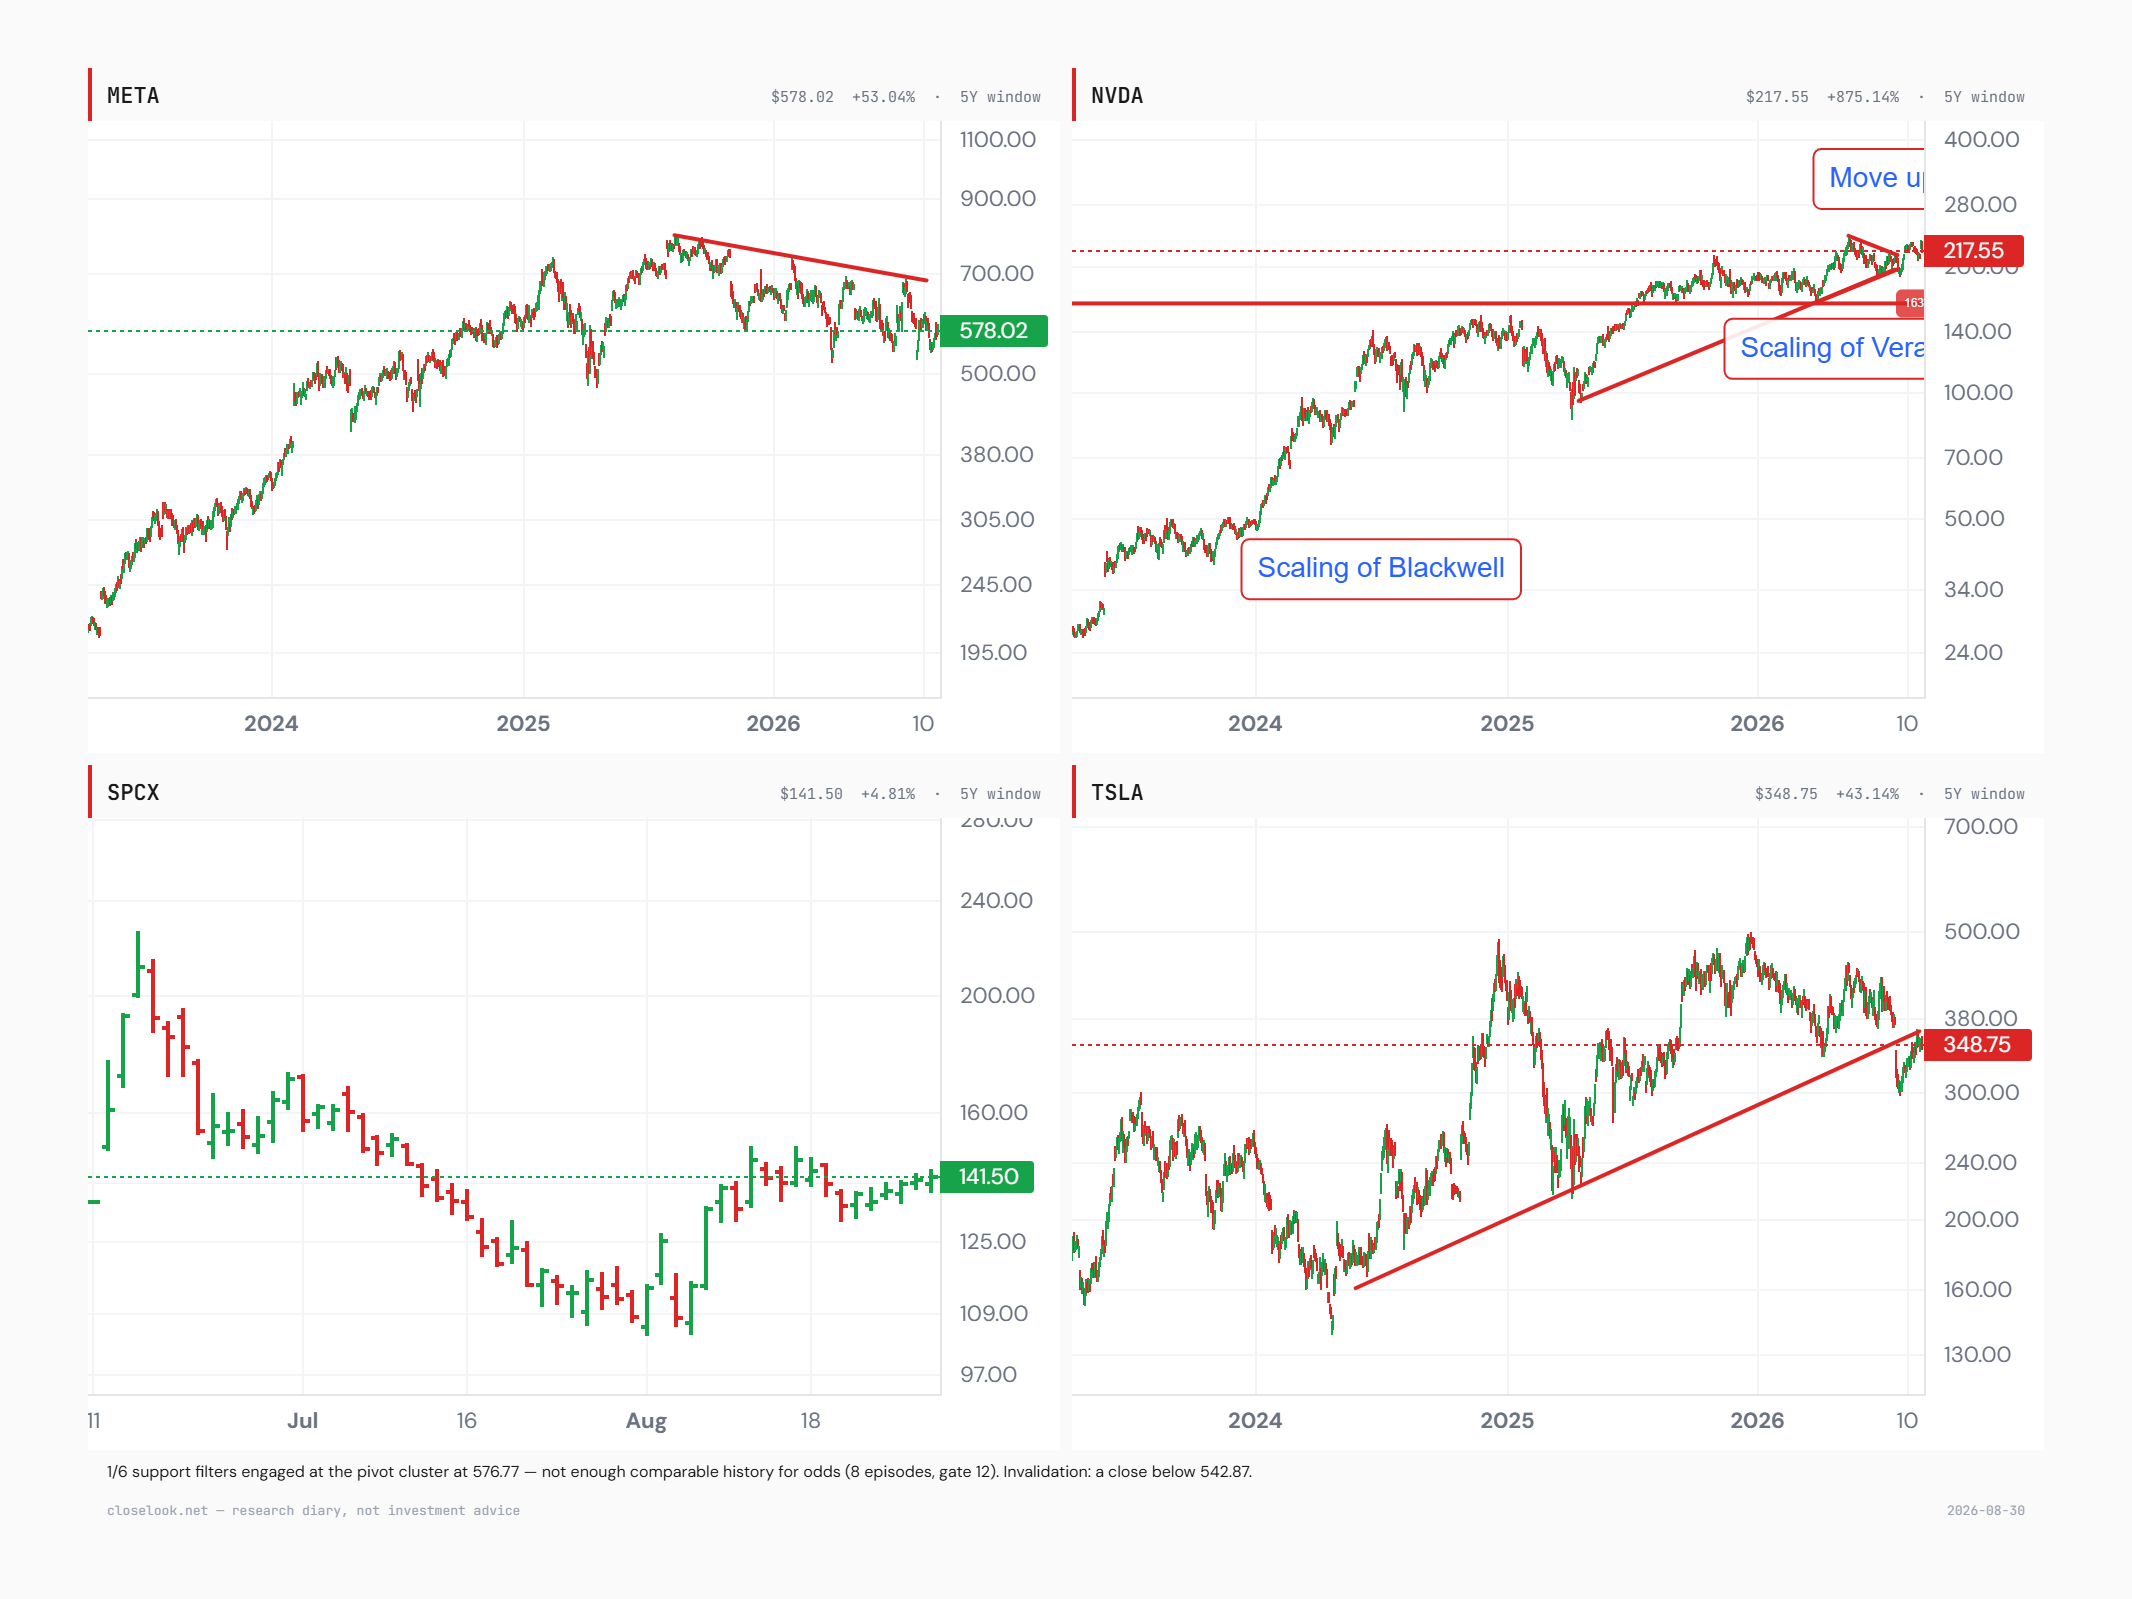
How to use this chart

Toolbar

  • Range — 1M to MAX on daily closes. 1D/5D switch a US stock cell to 5-minute intraday bars; index and foreign cells fall back to 1M daily with a note.
  • Grid — 1×1 up to 2×2. Cells are synchronized: pan or zoom one and the others follow the same dates; the crosshair tracks across all of them. 4 INDICES loads Rubin · HALO · AEI · AW40 side by side.
  • Type / Scale — OHLC, line or area; linear or log price axis.

Picking a series

  • Tap the box in a cell's header to browse every Closelooknet series — headline indices, sub-indices, sectors, layers of all six families — plus the constituents.
  • Or type any ticker (NVDA, 7203.T, ASML.AS …) and press Enter — it charts in the cell straight from our data lake.

Studies

  • Overlays / Oscillators rows toggle the standard set (SMA, Bollinger, RSI, MACD …) per cell.
  • Levels (stock cells) draws the structure engine's support lines — regression bands, pivot cluster, SMA-200, the active fib zone.

Drawing

  • Tap a tool (Trend, Ray, H-Line, Fib, Channel, Rect, Note), then tap the chart once per point — the shape follows your finger or cursor between taps. The chart stops panning while a tool is armed; tap the tool again to release.
  • Drawings save per symbol in this browser and travel between the terminal and the asset page.
  • Delete key removes the selected drawing · Escape cancels a half-placed one · Clear wipes the symbol.

Wave counts

  • Wave places an Elliott count: tap the origin, then each wave end. Press Enter to stop early (inside wave 3 is fine) — dotted ghost targets sketch the remaining waves at guideline ratios.
  • On stocks the scanner's machine count appears automatically in grey — it is fully editable: drag any point, double-tap a label to remove it, Delete to dismiss it for good, Adopt to bring the machine's proposal back.
  • The sequence picker switches 1-5 / A-B-C / A-E / W-X-Y-Z; 1 2 3 cycles the degree; Subdiv starts a one-degree-smaller child count inside a wave.

Sharing

  • Card exports the cell as a branded PNG — chart, drawings and levels exactly as shown.

Related in the Closelooknet universe

same Closelooknet index seat first, then Aerospace & Defense. Scored names rank on their Closelooknet score; names without one rank on trend state — above or below their 50- and 200-day averages — never on a score they do not carry.